Natronomonas moolapensis (strain DSM 18674 / CECT 7526 / JCM 14361 / 8.8.11)
Taxonomy: cellular organisms; Archaea; Euryarchaeota; Stenosarchaea group; Halobacteria; Halobacteriales; Haloarculaceae; Natronomonas; Natronomonas moolapensis
Average proteome isoelectric point is 4.89
Get precalculated fractions of proteins
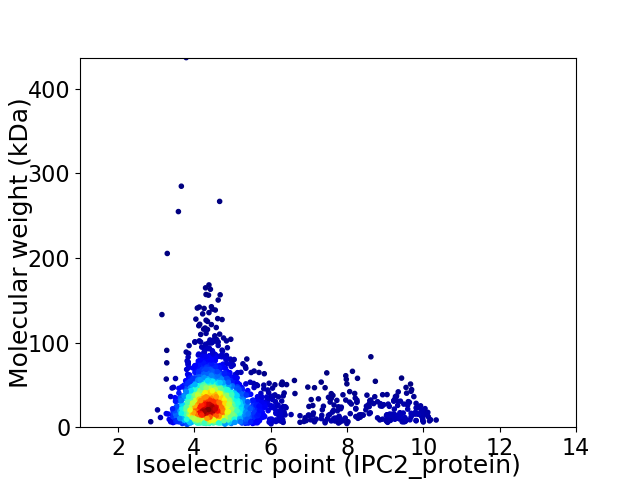
Virtual 2D-PAGE plot for 2723 proteins (isoelectric point calculated using IPC2_protein)
Get csv file with sequences according to given criteria:
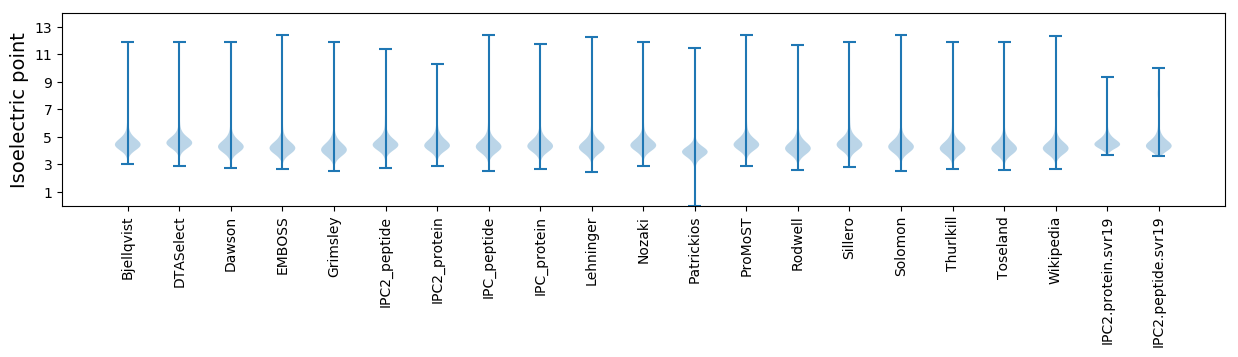
* You can choose from 21 different methods for calculating isoelectric point
Summary statistics related to proteome-wise predictions
Protein with the lowest isoelectric point:
>tr|M1XQF6|M1XQF6_NATM8 Uncharacterized protein OS=Natronomonas moolapensis (strain DSM 18674 / CECT 7526 / JCM 14361 / 8.8.11) OX=268739 GN=Nmlp_2222 PE=4 SV=1
MM1 pKa = 7.12SAPWATWDD9 pKa = 4.46HH10 pKa = 5.97IVKK13 pKa = 9.85IDD15 pKa = 3.66PDD17 pKa = 3.47KK18 pKa = 11.11TLVEE22 pKa = 4.48GEE24 pKa = 4.35TFEE27 pKa = 5.45DD28 pKa = 4.11VCATGTDD35 pKa = 3.39ALEE38 pKa = 4.37IGGTTGMTEE47 pKa = 3.57EE48 pKa = 3.89KK49 pKa = 9.12MARR52 pKa = 11.84VVEE55 pKa = 4.12ATTAYY60 pKa = 9.95DD61 pKa = 3.43VPVYY65 pKa = 10.36IEE67 pKa = 4.16PSNVGAVVHH76 pKa = 6.85RR77 pKa = 11.84EE78 pKa = 3.75GLDD81 pKa = 3.57GYY83 pKa = 9.43FVPIVLNAGDD93 pKa = 4.14VFWVTGAHH101 pKa = 6.41KK102 pKa = 9.94EE103 pKa = 3.86WARR106 pKa = 11.84LDD108 pKa = 4.82SEE110 pKa = 4.56IDD112 pKa = 3.07WMATFPEE119 pKa = 5.14AYY121 pKa = 9.9LVLNPDD127 pKa = 3.45SSVANYY133 pKa = 9.47TEE135 pKa = 4.41ADD137 pKa = 3.57CDD139 pKa = 3.43IDD141 pKa = 4.25ADD143 pKa = 4.06EE144 pKa = 4.3VAAYY148 pKa = 10.53AEE150 pKa = 4.25VAEE153 pKa = 4.43RR154 pKa = 11.84MFGQRR159 pKa = 11.84IVYY162 pKa = 9.53VEE164 pKa = 3.76YY165 pKa = 10.78SGTFGDD171 pKa = 4.16PEE173 pKa = 4.23MVQAATDD180 pKa = 3.74AVEE183 pKa = 4.3EE184 pKa = 4.2TSVFYY189 pKa = 11.03GGGIHH194 pKa = 7.59DD195 pKa = 4.88YY196 pKa = 11.03EE197 pKa = 5.02SAHH200 pKa = 5.52QMGRR204 pKa = 11.84HH205 pKa = 6.38ADD207 pKa = 3.92TIVVGDD213 pKa = 4.11LVHH216 pKa = 7.59DD217 pKa = 4.36EE218 pKa = 4.53GVDD221 pKa = 3.65AVAEE225 pKa = 4.3TVEE228 pKa = 4.57GVADD232 pKa = 4.12ANSEE236 pKa = 4.33PIEE239 pKa = 4.27GAA241 pKa = 3.23
MM1 pKa = 7.12SAPWATWDD9 pKa = 4.46HH10 pKa = 5.97IVKK13 pKa = 9.85IDD15 pKa = 3.66PDD17 pKa = 3.47KK18 pKa = 11.11TLVEE22 pKa = 4.48GEE24 pKa = 4.35TFEE27 pKa = 5.45DD28 pKa = 4.11VCATGTDD35 pKa = 3.39ALEE38 pKa = 4.37IGGTTGMTEE47 pKa = 3.57EE48 pKa = 3.89KK49 pKa = 9.12MARR52 pKa = 11.84VVEE55 pKa = 4.12ATTAYY60 pKa = 9.95DD61 pKa = 3.43VPVYY65 pKa = 10.36IEE67 pKa = 4.16PSNVGAVVHH76 pKa = 6.85RR77 pKa = 11.84EE78 pKa = 3.75GLDD81 pKa = 3.57GYY83 pKa = 9.43FVPIVLNAGDD93 pKa = 4.14VFWVTGAHH101 pKa = 6.41KK102 pKa = 9.94EE103 pKa = 3.86WARR106 pKa = 11.84LDD108 pKa = 4.82SEE110 pKa = 4.56IDD112 pKa = 3.07WMATFPEE119 pKa = 5.14AYY121 pKa = 9.9LVLNPDD127 pKa = 3.45SSVANYY133 pKa = 9.47TEE135 pKa = 4.41ADD137 pKa = 3.57CDD139 pKa = 3.43IDD141 pKa = 4.25ADD143 pKa = 4.06EE144 pKa = 4.3VAAYY148 pKa = 10.53AEE150 pKa = 4.25VAEE153 pKa = 4.43RR154 pKa = 11.84MFGQRR159 pKa = 11.84IVYY162 pKa = 9.53VEE164 pKa = 3.76YY165 pKa = 10.78SGTFGDD171 pKa = 4.16PEE173 pKa = 4.23MVQAATDD180 pKa = 3.74AVEE183 pKa = 4.3EE184 pKa = 4.2TSVFYY189 pKa = 11.03GGGIHH194 pKa = 7.59DD195 pKa = 4.88YY196 pKa = 11.03EE197 pKa = 5.02SAHH200 pKa = 5.52QMGRR204 pKa = 11.84HH205 pKa = 6.38ADD207 pKa = 3.92TIVVGDD213 pKa = 4.11LVHH216 pKa = 7.59DD217 pKa = 4.36EE218 pKa = 4.53GVDD221 pKa = 3.65AVAEE225 pKa = 4.3TVEE228 pKa = 4.57GVADD232 pKa = 4.12ANSEE236 pKa = 4.33PIEE239 pKa = 4.27GAA241 pKa = 3.23
Molecular weight: 26.04 kDa
Isoelectric point according different methods:
Protein with the highest isoelectric point:
>tr|M1XP12|M1XP12_NATM8 Orotate phosphoribosyltransferase OS=Natronomonas moolapensis (strain DSM 18674 / CECT 7526 / JCM 14361 / 8.8.11) OX=268739 GN=pyrE1 PE=3 SV=1
MM1 pKa = 7.48KK2 pKa = 10.32KK3 pKa = 10.3NVGGTDD9 pKa = 2.72RR10 pKa = 11.84VVRR13 pKa = 11.84LVLGSALIVAGIAGYY28 pKa = 10.76AGLLPLAAGSLPQALTAVVVFVLGAVLLATGLIRR62 pKa = 11.84RR63 pKa = 11.84CPLNRR68 pKa = 11.84LVGLDD73 pKa = 3.61TYY75 pKa = 11.81
MM1 pKa = 7.48KK2 pKa = 10.32KK3 pKa = 10.3NVGGTDD9 pKa = 2.72RR10 pKa = 11.84VVRR13 pKa = 11.84LVLGSALIVAGIAGYY28 pKa = 10.76AGLLPLAAGSLPQALTAVVVFVLGAVLLATGLIRR62 pKa = 11.84RR63 pKa = 11.84CPLNRR68 pKa = 11.84LVGLDD73 pKa = 3.61TYY75 pKa = 11.81
Molecular weight: 7.63 kDa
Isoelectric point according different methods:
Peptides (in silico digests for buttom-up proteomics)
Below you can find in silico digests of the whole proteome with Trypsin, Chymotrypsin, Trypsin+LysC, LysN, ArgC proteases suitable for different mass spec machines.| Try ESI |
 |
|---|
| ChTry ESI |
|
|---|
| ArgC ESI |
|
|---|
| LysN ESI |
|
|---|
| TryLysC ESI |
|
|---|
| Try MALDI |
|
|---|
| ChTry MALDI |
|
|---|
| ArgC MALDI |
|
|---|
| LysN MALDI |
|
|---|
| TryLysC MALDI |
|
|---|
| Try LTQ |
|
|---|
| ChTry LTQ |
|
|---|
| ArgC LTQ |
|
|---|
| LysN LTQ |
|
|---|
| TryLysC LTQ |
|
|---|
| Try MSlow |
|
|---|
| ChTry MSlow |
|
|---|
| ArgC MSlow |
|
|---|
| LysN MSlow |
|
|---|
| TryLysC MSlow |
|
|---|
| Try MShigh |
|
|---|
| ChTry MShigh |
|
|---|
| ArgC MShigh |
|
|---|
| LysN MShigh |
|
|---|
| TryLysC MShigh |
|
|---|
General Statistics
Number of major isoforms |
Number of additional isoforms |
Number of all proteins |
Number of amino acids |
Min. Seq. Length |
Max. Seq. Length |
Avg. Seq. Length |
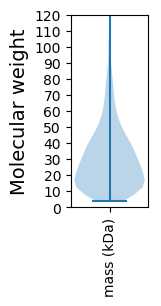
Avg. Mol. Weight |
|---|---|---|---|---|---|---|---|
0 |
809592 |
31 |
4220 |
297.3 |
32.19 |
Amino acid frequency
Ala |
Cys |
Asp |
Glu |
Phe |
Gly |
His |
Ile |
Lys |
Leu |
|---|---|---|---|---|---|---|---|---|---|
11.202 ± 0.076 | 0.767 ± 0.017 |
8.228 ± 0.052 | 8.839 ± 0.071 |
3.197 ± 0.028 | 8.898 ± 0.055 |
1.941 ± 0.023 | 4.101 ± 0.03 |
1.863 ± 0.028 | 8.699 ± 0.065 |
Met |
Asn |
Gln |
Pro |
Arg |
Ser |
Thr |
Val |
Trp |
Tyr |
|---|---|---|---|---|---|---|---|---|---|
1.654 ± 0.022 | 2.307 ± 0.039 |
4.627 ± 0.034 | 2.213 ± 0.028 |
6.909 ± 0.052 | 5.674 ± 0.057 |
6.388 ± 0.056 | 8.861 ± 0.047 |
0.993 ± 0.018 | 2.641 ± 0.028 |
Most of the basic statistics you can see at this page can be downloaded from this CSV file
See this proteome in:

Proteome-pI is available under Creative Commons Attribution-NoDerivs license, for more details see here
| Reference: Kozlowski LP. Proteome-pI 2.0: Proteome Isoelectric Point Database Update. Nucleic Acids Res. 2021, doi: 10.1093/nar/gkab944 | Contact: Lukasz P. Kozlowski |