Streptococcus phage Javan107
Taxonomy: Viruses; Duplodnaviria; Heunggongvirae; Uroviricota; Caudoviricetes; Caudovirales; Siphoviridae; unclassified Siphoviridae
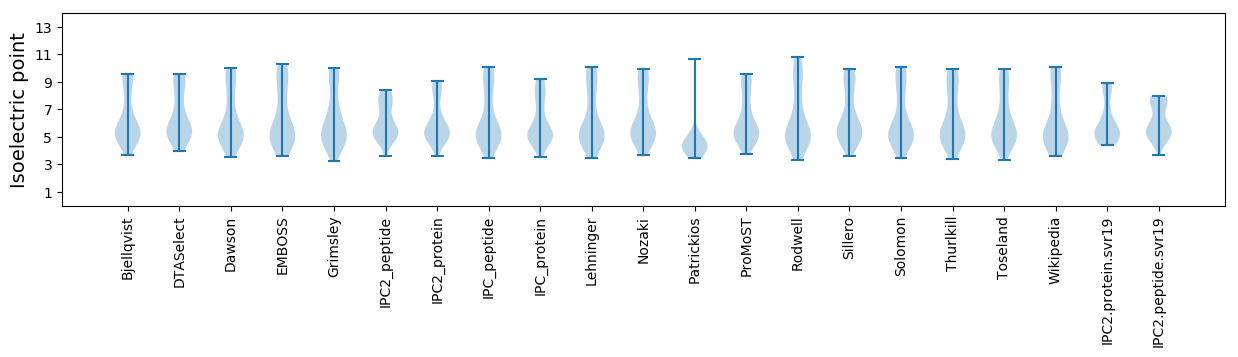
Average proteome isoelectric point is 6.16
Get precalculated fractions of proteins
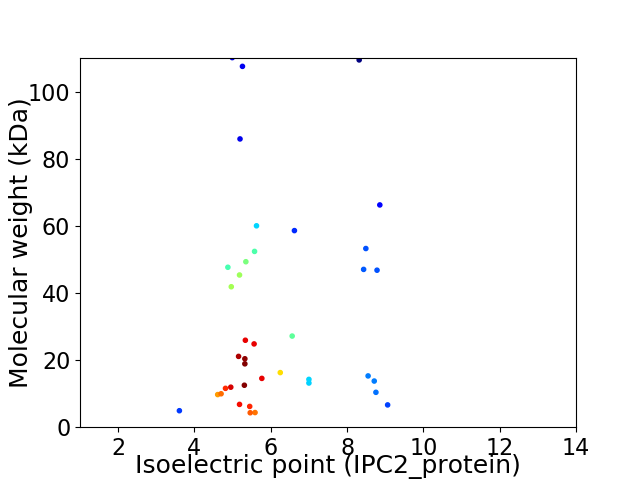
Virtual 2D-PAGE plot for 39 proteins (isoelectric point calculated using IPC2_protein)
Get csv file with sequences according to given criteria:
* You can choose from 21 different methods for calculating isoelectric point
Summary statistics related to proteome-wise predictions

Protein with the lowest isoelectric point:
>tr|A0A4D6A2W8|A0A4D6A2W8_9CAUD DNA primase/helicase OS=Streptococcus phage Javan107 OX=2547978 GN=Javan107_0033 PE=4 SV=1
MM1 pKa = 8.3DD2 pKa = 5.73DD3 pKa = 3.96PRR5 pKa = 11.84PVPVGILGTVIDD17 pKa = 4.12VDD19 pKa = 4.95DD20 pKa = 4.55IGSLIVSWDD29 pKa = 3.17NGQSLNVLYY38 pKa = 10.79GIDD41 pKa = 3.74SVEE44 pKa = 4.22KK45 pKa = 10.26II46 pKa = 3.85
MM1 pKa = 8.3DD2 pKa = 5.73DD3 pKa = 3.96PRR5 pKa = 11.84PVPVGILGTVIDD17 pKa = 4.12VDD19 pKa = 4.95DD20 pKa = 4.55IGSLIVSWDD29 pKa = 3.17NGQSLNVLYY38 pKa = 10.79GIDD41 pKa = 3.74SVEE44 pKa = 4.22KK45 pKa = 10.26II46 pKa = 3.85
Molecular weight: 4.93 kDa
Isoelectric point according different methods:
Protein with the highest isoelectric point:
>tr|A0A4D5ZXN7|A0A4D5ZXN7_9CAUD Uncharacterized protein OS=Streptococcus phage Javan107 OX=2547978 GN=Javan107_0030 PE=4 SV=1
MM1 pKa = 8.16DD2 pKa = 5.24IYY4 pKa = 10.94TILLCTILGIYY15 pKa = 9.46VFLGLYY21 pKa = 9.52LNYY24 pKa = 8.2MTIRR28 pKa = 11.84DD29 pKa = 4.0DD30 pKa = 3.09IRR32 pKa = 11.84RR33 pKa = 11.84EE34 pKa = 3.9KK35 pKa = 10.04EE36 pKa = 3.45RR37 pKa = 11.84KK38 pKa = 9.3AEE40 pKa = 4.37KK41 pKa = 10.04KK42 pKa = 10.48RR43 pKa = 11.84PDD45 pKa = 3.54NNTTPLHH52 pKa = 6.53RR53 pKa = 11.84SRR55 pKa = 5.13
MM1 pKa = 8.16DD2 pKa = 5.24IYY4 pKa = 10.94TILLCTILGIYY15 pKa = 9.46VFLGLYY21 pKa = 9.52LNYY24 pKa = 8.2MTIRR28 pKa = 11.84DD29 pKa = 4.0DD30 pKa = 3.09IRR32 pKa = 11.84RR33 pKa = 11.84EE34 pKa = 3.9KK35 pKa = 10.04EE36 pKa = 3.45RR37 pKa = 11.84KK38 pKa = 9.3AEE40 pKa = 4.37KK41 pKa = 10.04KK42 pKa = 10.48RR43 pKa = 11.84PDD45 pKa = 3.54NNTTPLHH52 pKa = 6.53RR53 pKa = 11.84SRR55 pKa = 5.13
Molecular weight: 6.66 kDa
Isoelectric point according different methods:
Peptides (in silico digests for buttom-up proteomics)
Below you can find in silico digests of the whole proteome with Trypsin, Chymotrypsin, Trypsin+LysC, LysN, ArgC proteases suitable for different mass spec machines.| Try ESI |
 |
|---|
| ChTry ESI |
|
|---|
| ArgC ESI |
|
|---|
| LysN ESI |
|
|---|
| TryLysC ESI |
|
|---|
| Try MALDI |
|
|---|
| ChTry MALDI |
|
|---|
| ArgC MALDI |
|
|---|
| LysN MALDI |
|
|---|
| TryLysC MALDI |
|
|---|
| Try LTQ |
|
|---|
| ChTry LTQ |
|
|---|
| ArgC LTQ |
|
|---|
| LysN LTQ |
|
|---|
| TryLysC LTQ |
|
|---|
| Try MSlow |
|
|---|
| ChTry MSlow |
|
|---|
| ArgC MSlow |
|
|---|
| LysN MSlow |
|
|---|
| TryLysC MSlow |
|
|---|
| Try MShigh |
|
|---|
| ChTry MShigh |
|
|---|
| ArgC MShigh |
|
|---|
| LysN MShigh |
|
|---|
| TryLysC MShigh |
|
|---|
General Statistics
Number of major isoforms |
Number of additional isoforms |
Number of all proteins |
Number of amino acids |
Min. Seq. Length |
Max. Seq. Length |
Avg. Seq. Length |
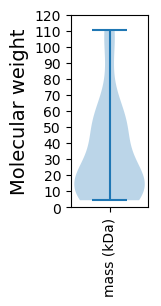
Avg. Mol. Weight |
|---|---|---|---|---|---|---|---|
0 |
11660 |
37 |
1039 |
299.0 |
33.58 |
Amino acid frequency
Ala |
Cys |
Asp |
Glu |
Phe |
Gly |
His |
Ile |
Lys |
Leu |
|---|---|---|---|---|---|---|---|---|---|
7.041 ± 0.499 | 0.892 ± 0.188 |
5.883 ± 0.364 | 7.187 ± 0.387 |
3.611 ± 0.181 | 6.947 ± 0.387 |
2.024 ± 0.165 | 5.798 ± 0.272 |
7.341 ± 0.27 | 9.245 ± 0.268 |
Met |
Asn |
Gln |
Pro |
Arg |
Ser |
Thr |
Val |
Trp |
Tyr |
|---|---|---|---|---|---|---|---|---|---|
2.333 ± 0.148 | 4.271 ± 0.22 |
3.062 ± 0.186 | 4.434 ± 0.277 |
4.674 ± 0.422 | 6.818 ± 0.395 |
6.93 ± 0.47 | 6.475 ± 0.275 |
1.432 ± 0.096 | 3.602 ± 0.272 |
Most of the basic statistics you can see at this page can be downloaded from this CSV file
See this proteome in:

Proteome-pI is available under Creative Commons Attribution-NoDerivs license, for more details see here
| Reference: Kozlowski LP. Proteome-pI 2.0: Proteome Isoelectric Point Database Update. Nucleic Acids Res. 2021, doi: 10.1093/nar/gkab944 | Contact: Lukasz P. Kozlowski |