Bacillus phage BtiUFT6.51-F
Taxonomy: Viruses; Duplodnaviria; Heunggongvirae; Uroviricota; Caudoviricetes; Caudovirales; Siphoviridae; Camtrevirus; unclassified Camtrevirus
Average proteome isoelectric point is 6.93
Get precalculated fractions of proteins
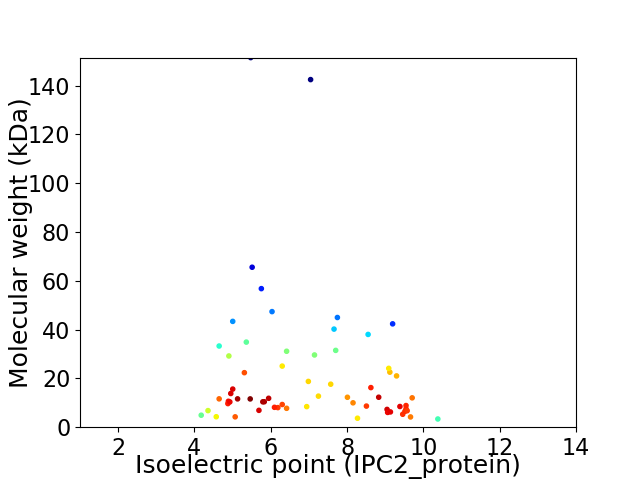
Virtual 2D-PAGE plot for 63 proteins (isoelectric point calculated using IPC2_protein)
Get csv file with sequences according to given criteria:
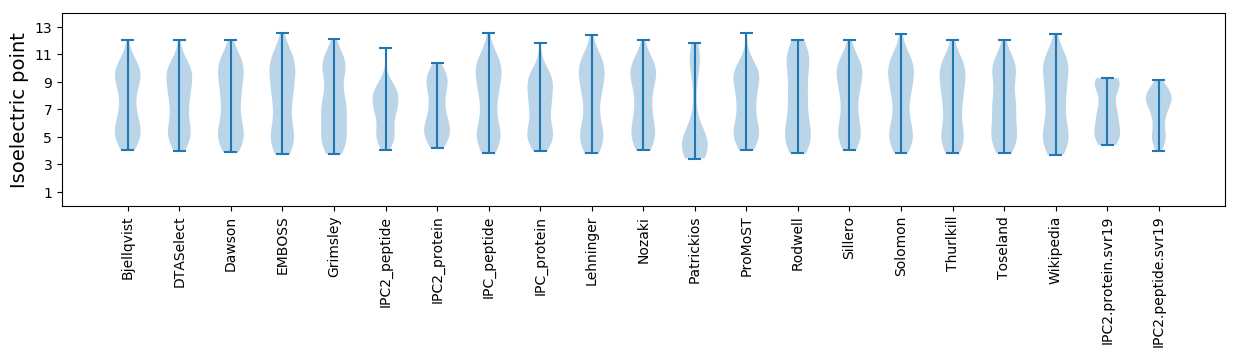
* You can choose from 21 different methods for calculating isoelectric point
Summary statistics related to proteome-wise predictions
Protein with the lowest isoelectric point:
>tr|A0A2I6UF39|A0A2I6UF39_9CAUD Uncharacterized protein OS=Bacillus phage BtiUFT6.51-F OX=2069313 GN=XO27_0023 PE=4 SV=1
MM1 pKa = 7.58GLNGLIGGIEE11 pKa = 3.88MTKK14 pKa = 10.67EE15 pKa = 3.82EE16 pKa = 4.28IVEE19 pKa = 4.19LFLNTVDD26 pKa = 3.52EE27 pKa = 5.02AKK29 pKa = 10.57PEE31 pKa = 4.56LIEE34 pKa = 4.27EE35 pKa = 4.44YY36 pKa = 9.96IEE38 pKa = 3.89EE39 pKa = 4.2SFRR42 pKa = 11.84II43 pKa = 4.0
MM1 pKa = 7.58GLNGLIGGIEE11 pKa = 3.88MTKK14 pKa = 10.67EE15 pKa = 3.82EE16 pKa = 4.28IVEE19 pKa = 4.19LFLNTVDD26 pKa = 3.52EE27 pKa = 5.02AKK29 pKa = 10.57PEE31 pKa = 4.56LIEE34 pKa = 4.27EE35 pKa = 4.44YY36 pKa = 9.96IEE38 pKa = 3.89EE39 pKa = 4.2SFRR42 pKa = 11.84II43 pKa = 4.0
Molecular weight: 4.91 kDa
Isoelectric point according different methods:
Protein with the highest isoelectric point:
>tr|A0A2I6UF37|A0A2I6UF37_9CAUD DNA-binding helix-turn-helix protein OS=Bacillus phage BtiUFT6.51-F OX=2069313 GN=XO27_0036 PE=4 SV=1
MM1 pKa = 7.4VIFWKK6 pKa = 10.54HH7 pKa = 6.1DD8 pKa = 3.29ILRR11 pKa = 11.84LTHH14 pKa = 6.66TGQLFPKK21 pKa = 8.76RR22 pKa = 11.84WLGKK26 pKa = 7.77RR27 pKa = 11.84CKK29 pKa = 10.23RR30 pKa = 11.84NFQLAPLTHH39 pKa = 6.91ASMGLYY45 pKa = 9.66LCSIIIFQFDD55 pKa = 3.57KK56 pKa = 11.13PLVLLSLSS64 pKa = 3.54
MM1 pKa = 7.4VIFWKK6 pKa = 10.54HH7 pKa = 6.1DD8 pKa = 3.29ILRR11 pKa = 11.84LTHH14 pKa = 6.66TGQLFPKK21 pKa = 8.76RR22 pKa = 11.84WLGKK26 pKa = 7.77RR27 pKa = 11.84CKK29 pKa = 10.23RR30 pKa = 11.84NFQLAPLTHH39 pKa = 6.91ASMGLYY45 pKa = 9.66LCSIIIFQFDD55 pKa = 3.57KK56 pKa = 11.13PLVLLSLSS64 pKa = 3.54
Molecular weight: 7.54 kDa
Isoelectric point according different methods:
Peptides (in silico digests for buttom-up proteomics)
Below you can find in silico digests of the whole proteome with Trypsin, Chymotrypsin, Trypsin+LysC, LysN, ArgC proteases suitable for different mass spec machines.| Try ESI |
 |
|---|
| ChTry ESI |
|
|---|
| ArgC ESI |
|
|---|
| LysN ESI |
|
|---|
| TryLysC ESI |
|
|---|
| Try MALDI |
|
|---|
| ChTry MALDI |
|
|---|
| ArgC MALDI |
|
|---|
| LysN MALDI |
|
|---|
| TryLysC MALDI |
|
|---|
| Try LTQ |
|
|---|
| ChTry LTQ |
|
|---|
| ArgC LTQ |
|
|---|
| LysN LTQ |
|
|---|
| TryLysC LTQ |
|
|---|
| Try MSlow |
|
|---|
| ChTry MSlow |
|
|---|
| ArgC MSlow |
|
|---|
| LysN MSlow |
|
|---|
| TryLysC MSlow |
|
|---|
| Try MShigh |
|
|---|
| ChTry MShigh |
|
|---|
| ArgC MShigh |
|
|---|
| LysN MShigh |
|
|---|
| TryLysC MShigh |
|
|---|
General Statistics
Number of major isoforms |
Number of additional isoforms |
Number of all proteins |
Number of amino acids |
Min. Seq. Length |
Max. Seq. Length |
Avg. Seq. Length |
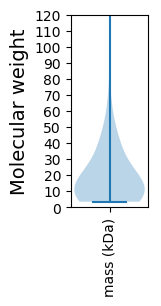
Avg. Mol. Weight |
|---|---|---|---|---|---|---|---|
0 |
11944 |
28 |
1341 |
189.6 |
21.73 |
Amino acid frequency
Ala |
Cys |
Asp |
Glu |
Phe |
Gly |
His |
Ile |
Lys |
Leu |
|---|---|---|---|---|---|---|---|---|---|
6.355 ± 0.569 | 0.887 ± 0.173 |
5.417 ± 0.248 | 8.255 ± 0.308 |
4.203 ± 0.274 | 5.509 ± 0.367 |
1.783 ± 0.182 | 7.05 ± 0.256 |
9.503 ± 0.259 | 8.163 ± 0.353 |
Met |
Asn |
Gln |
Pro |
Arg |
Ser |
Thr |
Val |
Trp |
Tyr |
|---|---|---|---|---|---|---|---|---|---|
3.039 ± 0.206 | 5.635 ± 0.213 |
2.746 ± 0.23 | 4.488 ± 0.268 |
4.605 ± 0.203 | 5.702 ± 0.198 |
5.626 ± 0.354 | 6.162 ± 0.247 |
1.222 ± 0.117 | 3.65 ± 0.235 |
Most of the basic statistics you can see at this page can be downloaded from this CSV file
See this proteome in:

Proteome-pI is available under Creative Commons Attribution-NoDerivs license, for more details see here
| Reference: Kozlowski LP. Proteome-pI 2.0: Proteome Isoelectric Point Database Update. Nucleic Acids Res. 2021, doi: 10.1093/nar/gkab944 | Contact: Lukasz P. Kozlowski |