Eubacterium callanderi
Taxonomy: cellular organisms; Bacteria; Terrabacteria group; Firmicutes; Clostridia; Eubacteriales; Eubacteriaceae; Eubacterium
Average proteome isoelectric point is 6.25
Get precalculated fractions of proteins
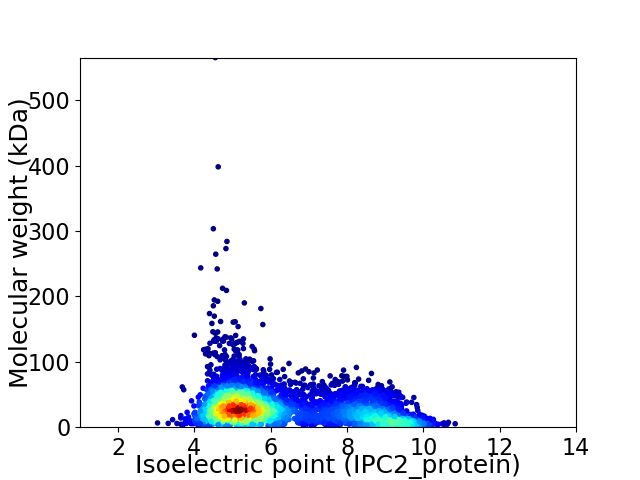
Virtual 2D-PAGE plot for 4506 proteins (isoelectric point calculated using IPC2_protein)
Get csv file with sequences according to given criteria:
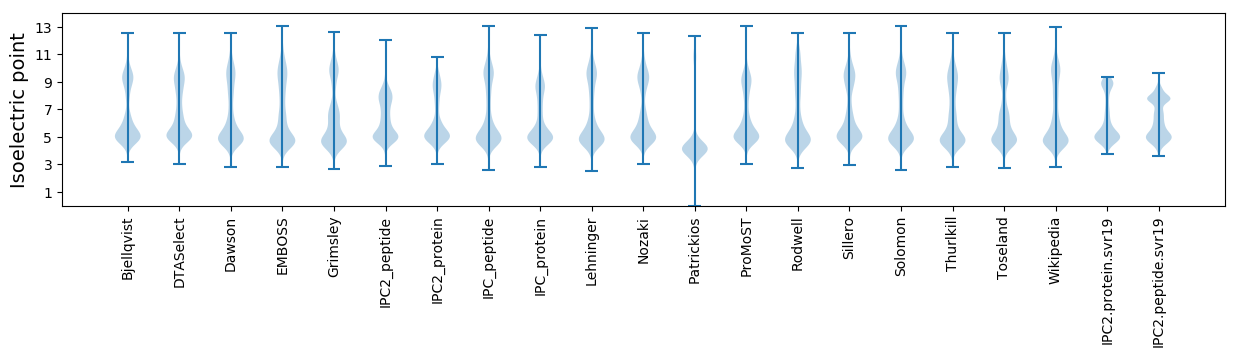
* You can choose from 21 different methods for calculating isoelectric point
Summary statistics related to proteome-wise predictions
Protein with the lowest isoelectric point:
>tr|E3GHY1|E3GHY1_9FIRM Nudix hydrolase domain-containing protein OS=Eubacterium callanderi OX=53442 GN=ELI_0246 PE=3 SV=1
MM1 pKa = 7.37KK2 pKa = 10.0KK3 pKa = 9.57QWIALLTGCVLVCSMLAGCGSKK25 pKa = 10.15PQTSAPAAAGSDD37 pKa = 3.46KK38 pKa = 11.26GCTDD42 pKa = 3.64EE43 pKa = 6.79AILSQLKK50 pKa = 10.53NDD52 pKa = 3.86GTPEE56 pKa = 3.84FVLDD60 pKa = 3.5GTYY63 pKa = 8.91YY64 pKa = 10.19TLPLEE69 pKa = 4.46TSQLIQAGWSLEE81 pKa = 4.04TEE83 pKa = 4.43EE84 pKa = 4.36YY85 pKa = 10.74DD86 pKa = 3.45AAEE89 pKa = 4.39VSLQPGEE96 pKa = 4.34RR97 pKa = 11.84IYY99 pKa = 11.6GEE101 pKa = 4.12LSKK104 pKa = 10.92DD105 pKa = 3.48DD106 pKa = 3.85QEE108 pKa = 5.09IDD110 pKa = 3.68VAIVNAGTEE119 pKa = 4.0PCKK122 pKa = 9.75PAEE125 pKa = 4.47GGTVVEE131 pKa = 4.99LEE133 pKa = 3.97YY134 pKa = 11.12SADD137 pKa = 3.63KK138 pKa = 10.79DD139 pKa = 3.75QPNPDD144 pKa = 3.41FFVTLNGINCAMSNAALQKK163 pKa = 10.72ALEE166 pKa = 4.44GVDD169 pKa = 4.04GYY171 pKa = 11.68KK172 pKa = 10.66LNSAGNIDD180 pKa = 3.63INRR183 pKa = 11.84TVDD186 pKa = 3.39DD187 pKa = 5.14DD188 pKa = 4.68EE189 pKa = 4.99IAVYY193 pKa = 10.17KK194 pKa = 10.76VILDD198 pKa = 4.03DD199 pKa = 5.59DD200 pKa = 4.12YY201 pKa = 11.97TAITLASDD209 pKa = 3.49NVFEE213 pKa = 4.48YY214 pKa = 10.83KK215 pKa = 10.25DD216 pKa = 3.74YY217 pKa = 11.19QPQEE221 pKa = 4.22VKK223 pKa = 10.55EE224 pKa = 3.91QASNEE229 pKa = 3.93KK230 pKa = 9.69IAAYY234 pKa = 9.89KK235 pKa = 9.47DD236 pKa = 3.29TTKK239 pKa = 11.44AEE241 pKa = 4.16MEE243 pKa = 4.73PYY245 pKa = 10.44AQDD248 pKa = 3.16FNAIIEE254 pKa = 4.69GYY256 pKa = 8.71EE257 pKa = 3.8EE258 pKa = 4.19NMVVGFYY265 pKa = 10.91SEE267 pKa = 4.06GTIWGEE273 pKa = 3.63EE274 pKa = 3.69VGEE277 pKa = 4.18YY278 pKa = 10.56KK279 pKa = 10.76SIAGTPLASDD289 pKa = 3.68VSLYY293 pKa = 10.25IAEE296 pKa = 4.48DD297 pKa = 3.59TTGQLYY303 pKa = 10.8CIANQILNEE312 pKa = 4.73DD313 pKa = 4.14GTVSTAIEE321 pKa = 4.4LEE323 pKa = 4.15EE324 pKa = 5.22GDD326 pKa = 3.88QVKK329 pKa = 10.02VWGYY333 pKa = 9.77ASQYY337 pKa = 11.32LEE339 pKa = 4.15LQEE342 pKa = 4.02GLKK345 pKa = 10.18IVVVQPGIIEE355 pKa = 4.27RR356 pKa = 11.84NGEE359 pKa = 4.17LVILDD364 pKa = 4.31KK365 pKa = 11.13NLKK368 pKa = 10.16ADD370 pKa = 3.4
MM1 pKa = 7.37KK2 pKa = 10.0KK3 pKa = 9.57QWIALLTGCVLVCSMLAGCGSKK25 pKa = 10.15PQTSAPAAAGSDD37 pKa = 3.46KK38 pKa = 11.26GCTDD42 pKa = 3.64EE43 pKa = 6.79AILSQLKK50 pKa = 10.53NDD52 pKa = 3.86GTPEE56 pKa = 3.84FVLDD60 pKa = 3.5GTYY63 pKa = 8.91YY64 pKa = 10.19TLPLEE69 pKa = 4.46TSQLIQAGWSLEE81 pKa = 4.04TEE83 pKa = 4.43EE84 pKa = 4.36YY85 pKa = 10.74DD86 pKa = 3.45AAEE89 pKa = 4.39VSLQPGEE96 pKa = 4.34RR97 pKa = 11.84IYY99 pKa = 11.6GEE101 pKa = 4.12LSKK104 pKa = 10.92DD105 pKa = 3.48DD106 pKa = 3.85QEE108 pKa = 5.09IDD110 pKa = 3.68VAIVNAGTEE119 pKa = 4.0PCKK122 pKa = 9.75PAEE125 pKa = 4.47GGTVVEE131 pKa = 4.99LEE133 pKa = 3.97YY134 pKa = 11.12SADD137 pKa = 3.63KK138 pKa = 10.79DD139 pKa = 3.75QPNPDD144 pKa = 3.41FFVTLNGINCAMSNAALQKK163 pKa = 10.72ALEE166 pKa = 4.44GVDD169 pKa = 4.04GYY171 pKa = 11.68KK172 pKa = 10.66LNSAGNIDD180 pKa = 3.63INRR183 pKa = 11.84TVDD186 pKa = 3.39DD187 pKa = 5.14DD188 pKa = 4.68EE189 pKa = 4.99IAVYY193 pKa = 10.17KK194 pKa = 10.76VILDD198 pKa = 4.03DD199 pKa = 5.59DD200 pKa = 4.12YY201 pKa = 11.97TAITLASDD209 pKa = 3.49NVFEE213 pKa = 4.48YY214 pKa = 10.83KK215 pKa = 10.25DD216 pKa = 3.74YY217 pKa = 11.19QPQEE221 pKa = 4.22VKK223 pKa = 10.55EE224 pKa = 3.91QASNEE229 pKa = 3.93KK230 pKa = 9.69IAAYY234 pKa = 9.89KK235 pKa = 9.47DD236 pKa = 3.29TTKK239 pKa = 11.44AEE241 pKa = 4.16MEE243 pKa = 4.73PYY245 pKa = 10.44AQDD248 pKa = 3.16FNAIIEE254 pKa = 4.69GYY256 pKa = 8.71EE257 pKa = 3.8EE258 pKa = 4.19NMVVGFYY265 pKa = 10.91SEE267 pKa = 4.06GTIWGEE273 pKa = 3.63EE274 pKa = 3.69VGEE277 pKa = 4.18YY278 pKa = 10.56KK279 pKa = 10.76SIAGTPLASDD289 pKa = 3.68VSLYY293 pKa = 10.25IAEE296 pKa = 4.48DD297 pKa = 3.59TTGQLYY303 pKa = 10.8CIANQILNEE312 pKa = 4.73DD313 pKa = 4.14GTVSTAIEE321 pKa = 4.4LEE323 pKa = 4.15EE324 pKa = 5.22GDD326 pKa = 3.88QVKK329 pKa = 10.02VWGYY333 pKa = 9.77ASQYY337 pKa = 11.32LEE339 pKa = 4.15LQEE342 pKa = 4.02GLKK345 pKa = 10.18IVVVQPGIIEE355 pKa = 4.27RR356 pKa = 11.84NGEE359 pKa = 4.17LVILDD364 pKa = 4.31KK365 pKa = 11.13NLKK368 pKa = 10.16ADD370 pKa = 3.4
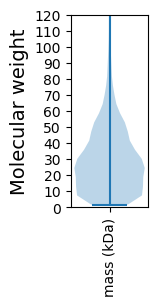
Molecular weight: 40.24 kDa
Isoelectric point according different methods:
Protein with the highest isoelectric point:
>tr|E3GHQ4|E3GHQ4_9FIRM DNA replication and repair protein RecF OS=Eubacterium callanderi OX=53442 GN=recF PE=3 SV=1
MM1 pKa = 7.45KK2 pKa = 9.53RR3 pKa = 11.84TFQPKK8 pKa = 8.2VRR10 pKa = 11.84QRR12 pKa = 11.84KK13 pKa = 8.76KK14 pKa = 8.26EE15 pKa = 3.53HH16 pKa = 6.07GFRR19 pKa = 11.84KK20 pKa = 9.98RR21 pKa = 11.84MSTTSGRR28 pKa = 11.84VILKK32 pKa = 9.77KK33 pKa = 10.22RR34 pKa = 11.84RR35 pKa = 11.84SKK37 pKa = 10.91GRR39 pKa = 11.84AKK41 pKa = 10.73LSAA44 pKa = 3.92
MM1 pKa = 7.45KK2 pKa = 9.53RR3 pKa = 11.84TFQPKK8 pKa = 8.2VRR10 pKa = 11.84QRR12 pKa = 11.84KK13 pKa = 8.76KK14 pKa = 8.26EE15 pKa = 3.53HH16 pKa = 6.07GFRR19 pKa = 11.84KK20 pKa = 9.98RR21 pKa = 11.84MSTTSGRR28 pKa = 11.84VILKK32 pKa = 9.77KK33 pKa = 10.22RR34 pKa = 11.84RR35 pKa = 11.84SKK37 pKa = 10.91GRR39 pKa = 11.84AKK41 pKa = 10.73LSAA44 pKa = 3.92
Molecular weight: 5.26 kDa
Isoelectric point according different methods:
Peptides (in silico digests for buttom-up proteomics)
Below you can find in silico digests of the whole proteome with Trypsin, Chymotrypsin, Trypsin+LysC, LysN, ArgC proteases suitable for different mass spec machines.| Try ESI |
 |
|---|
| ChTry ESI |
|
|---|
| ArgC ESI |
|
|---|
| LysN ESI |
|
|---|
| TryLysC ESI |
|
|---|
| Try MALDI |
|
|---|
| ChTry MALDI |
|
|---|
| ArgC MALDI |
|
|---|
| LysN MALDI |
|
|---|
| TryLysC MALDI |
|
|---|
| Try LTQ |
|
|---|
| ChTry LTQ |
|
|---|
| ArgC LTQ |
|
|---|
| LysN LTQ |
|
|---|
| TryLysC LTQ |
|
|---|
| Try MSlow |
|
|---|
| ChTry MSlow |
|
|---|
| ArgC MSlow |
|
|---|
| LysN MSlow |
|
|---|
| TryLysC MSlow |
|
|---|
| Try MShigh |
|
|---|
| ChTry MShigh |
|
|---|
| ArgC MShigh |
|
|---|
| LysN MShigh |
|
|---|
| TryLysC MShigh |
|
|---|
General Statistics
Number of major isoforms |
Number of additional isoforms |
Number of all proteins |
Number of amino acids |
Min. Seq. Length |
Max. Seq. Length |
Avg. Seq. Length |
Avg. Mol. Weight |
|---|---|---|---|---|---|---|---|
0 |
1283993 |
14 |
5266 |
285.0 |
31.75 |
Amino acid frequency
Ala |
Cys |
Asp |
Glu |
Phe |
Gly |
His |
Ile |
Lys |
Leu |
|---|---|---|---|---|---|---|---|---|---|
8.052 ± 0.042 | 1.422 ± 0.017 |
5.686 ± 0.036 | 7.112 ± 0.043 |
4.34 ± 0.031 | 7.308 ± 0.033 |
1.657 ± 0.015 | 7.292 ± 0.04 |
6.554 ± 0.032 | 9.284 ± 0.045 |
Met |
Asn |
Gln |
Pro |
Arg |
Ser |
Thr |
Val |
Trp |
Tyr |
|---|---|---|---|---|---|---|---|---|---|
2.981 ± 0.022 | 4.305 ± 0.032 |
3.72 ± 0.025 | 3.14 ± 0.02 |
4.365 ± 0.033 | 5.655 ± 0.032 |
5.589 ± 0.041 | 6.908 ± 0.031 |
0.861 ± 0.012 | 3.768 ± 0.026 |
Most of the basic statistics you can see at this page can be downloaded from this CSV file
See this proteome in:

Proteome-pI is available under Creative Commons Attribution-NoDerivs license, for more details see here
| Reference: Kozlowski LP. Proteome-pI 2.0: Proteome Isoelectric Point Database Update. Nucleic Acids Res. 2021, doi: 10.1093/nar/gkab944 | Contact: Lukasz P. Kozlowski |