Streptococcus satellite phage Javan245
Taxonomy: Viruses; unclassified bacterial viruses
Average proteome isoelectric point is 6.2
Get precalculated fractions of proteins
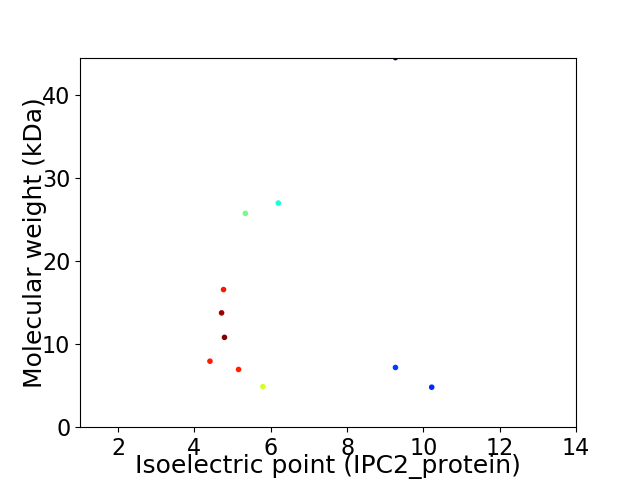
Virtual 2D-PAGE plot for 11 proteins (isoelectric point calculated using IPC2_protein)
Get csv file with sequences according to given criteria:
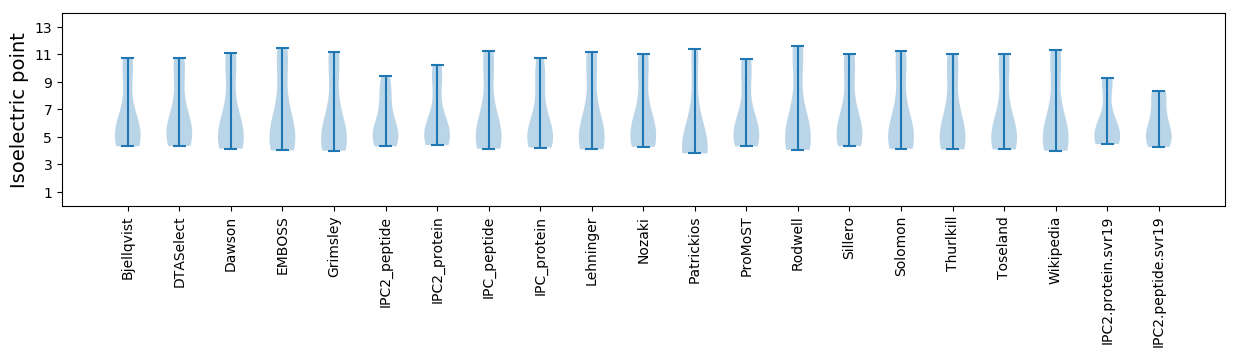
* You can choose from 21 different methods for calculating isoelectric point
Summary statistics related to proteome-wise predictions
Protein with the lowest isoelectric point:
>tr|A0A4D5ZHQ4|A0A4D5ZHQ4_9VIRU Uncharacterized protein OS=Streptococcus satellite phage Javan245 OX=2558589 GN=JavanS245_0005 PE=4 SV=1
MM1 pKa = 7.09EE2 pKa = 4.26QATSRR7 pKa = 11.84LNNVAVEE14 pKa = 4.05AVEE17 pKa = 4.04VLTAIMNDD25 pKa = 3.64PTISPYY31 pKa = 10.94ARR33 pKa = 11.84QQSARR38 pKa = 11.84TILEE42 pKa = 4.01FAYY45 pKa = 9.67KK46 pKa = 10.12AYY48 pKa = 9.89EE49 pKa = 3.87NEE51 pKa = 4.25AIIEE55 pKa = 4.08KK56 pKa = 10.56LEE58 pKa = 3.9EE59 pKa = 4.52LEE61 pKa = 4.34TVISIDD67 pKa = 4.39DD68 pKa = 3.56KK69 pKa = 11.82GII71 pKa = 3.54
MM1 pKa = 7.09EE2 pKa = 4.26QATSRR7 pKa = 11.84LNNVAVEE14 pKa = 4.05AVEE17 pKa = 4.04VLTAIMNDD25 pKa = 3.64PTISPYY31 pKa = 10.94ARR33 pKa = 11.84QQSARR38 pKa = 11.84TILEE42 pKa = 4.01FAYY45 pKa = 9.67KK46 pKa = 10.12AYY48 pKa = 9.89EE49 pKa = 3.87NEE51 pKa = 4.25AIIEE55 pKa = 4.08KK56 pKa = 10.56LEE58 pKa = 3.9EE59 pKa = 4.52LEE61 pKa = 4.34TVISIDD67 pKa = 4.39DD68 pKa = 3.56KK69 pKa = 11.82GII71 pKa = 3.54
Molecular weight: 7.96 kDa
Isoelectric point according different methods:
Protein with the highest isoelectric point:
>tr|A0A4D5ZI71|A0A4D5ZI71_9VIRU Integrase OS=Streptococcus satellite phage Javan245 OX=2558589 GN=JavanS245_0011 PE=3 SV=1
MM1 pKa = 7.34ATFLKK6 pKa = 10.39KK7 pKa = 9.96VRR9 pKa = 11.84KK10 pKa = 8.56NKK12 pKa = 9.66AYY14 pKa = 9.69KK15 pKa = 10.18RR16 pKa = 11.84LFQAVPRR23 pKa = 11.84HH24 pKa = 5.36SKK26 pKa = 10.65EE27 pKa = 3.81FLQMSWFSPLFYY39 pKa = 10.96
MM1 pKa = 7.34ATFLKK6 pKa = 10.39KK7 pKa = 9.96VRR9 pKa = 11.84KK10 pKa = 8.56NKK12 pKa = 9.66AYY14 pKa = 9.69KK15 pKa = 10.18RR16 pKa = 11.84LFQAVPRR23 pKa = 11.84HH24 pKa = 5.36SKK26 pKa = 10.65EE27 pKa = 3.81FLQMSWFSPLFYY39 pKa = 10.96
Molecular weight: 4.82 kDa
Isoelectric point according different methods:
Peptides (in silico digests for buttom-up proteomics)
Below you can find in silico digests of the whole proteome with Trypsin, Chymotrypsin, Trypsin+LysC, LysN, ArgC proteases suitable for different mass spec machines.| Try ESI |
 |
|---|
| ChTry ESI |
|
|---|
| ArgC ESI |
|
|---|
| LysN ESI |
|
|---|
| TryLysC ESI |
|
|---|
| Try MALDI |
|
|---|
| ChTry MALDI |
|
|---|
| ArgC MALDI |
|
|---|
| LysN MALDI |
|
|---|
| TryLysC MALDI |
|
|---|
| Try LTQ |
|
|---|
| ChTry LTQ |
|
|---|
| ArgC LTQ |
|
|---|
| LysN LTQ |
|
|---|
| TryLysC LTQ |
|
|---|
| Try MSlow |
|
|---|
| ChTry MSlow |
|
|---|
| ArgC MSlow |
|
|---|
| LysN MSlow |
|
|---|
| TryLysC MSlow |
|
|---|
| Try MShigh |
|
|---|
| ChTry MShigh |
|
|---|
| ArgC MShigh |
|
|---|
| LysN MShigh |
|
|---|
| TryLysC MShigh |
|
|---|
General Statistics
Number of major isoforms |
Number of additional isoforms |
Number of all proteins |
Number of amino acids |
Min. Seq. Length |
Max. Seq. Length |
Avg. Seq. Length |
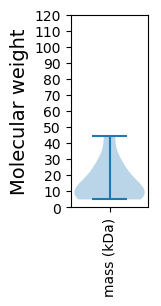
Avg. Mol. Weight |
|---|---|---|---|---|---|---|---|
0 |
1477 |
39 |
388 |
134.3 |
15.49 |
Amino acid frequency
Ala |
Cys |
Asp |
Glu |
Phe |
Gly |
His |
Ile |
Lys |
Leu |
|---|---|---|---|---|---|---|---|---|---|
5.281 ± 0.737 | 0.542 ± 0.144 |
5.958 ± 0.943 | 6.974 ± 0.738 |
4.942 ± 0.558 | 4.062 ± 0.394 |
1.49 ± 0.426 | 9.005 ± 0.917 |
8.666 ± 0.718 | 9.614 ± 0.485 |
Met |
Asn |
Gln |
Pro |
Arg |
Ser |
Thr |
Val |
Trp |
Tyr |
|---|---|---|---|---|---|---|---|---|---|
2.302 ± 0.372 | 6.703 ± 0.673 |
3.114 ± 0.276 | 3.182 ± 0.47 |
4.604 ± 0.379 | 6.229 ± 0.304 |
6.026 ± 0.507 | 6.026 ± 0.467 |
0.88 ± 0.21 | 4.401 ± 0.539 |
Most of the basic statistics you can see at this page can be downloaded from this CSV file
See this proteome in:

Proteome-pI is available under Creative Commons Attribution-NoDerivs license, for more details see here
| Reference: Kozlowski LP. Proteome-pI 2.0: Proteome Isoelectric Point Database Update. Nucleic Acids Res. 2021, doi: 10.1093/nar/gkab944 | Contact: Lukasz P. Kozlowski |