Novosphingobium sp. AAP1
Taxonomy: cellular organisms; Bacteria; Proteobacteria; Alphaproteobacteria; Sphingomonadales; Sphingomonadaceae; Novosphingobium; unclassified Novosphingobium
Average proteome isoelectric point is 6.67
Get precalculated fractions of proteins
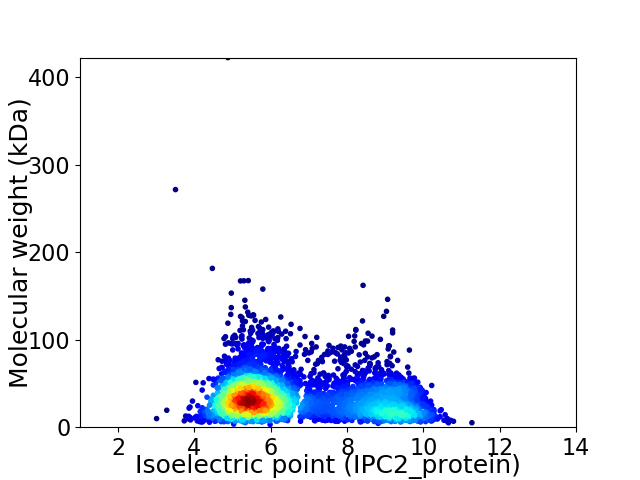
Virtual 2D-PAGE plot for 3896 proteins (isoelectric point calculated using IPC2_protein)
Get csv file with sequences according to given criteria:
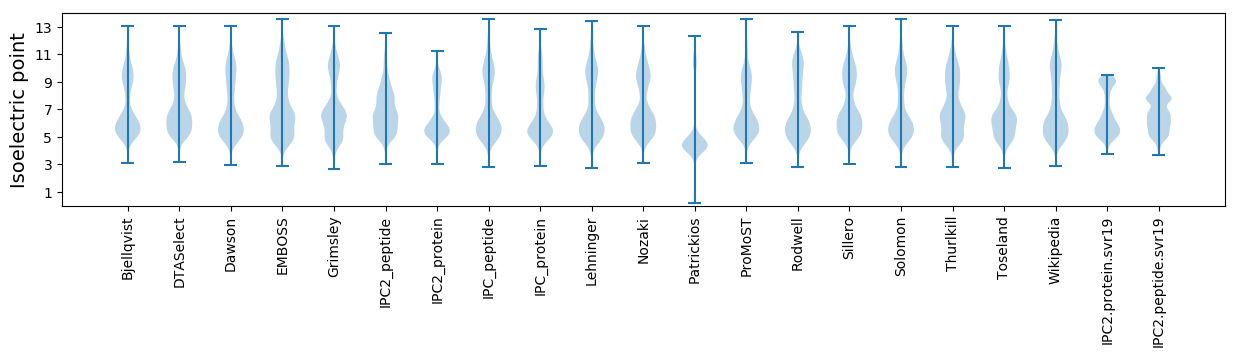
* You can choose from 21 different methods for calculating isoelectric point
Summary statistics related to proteome-wise predictions
Protein with the lowest isoelectric point:
>tr|A0A0N1ALU6|A0A0N1ALU6_9SPHN Histidine kinase OS=Novosphingobium sp. AAP1 OX=1523413 GN=IP65_11340 PE=4 SV=1
MM1 pKa = 7.12RR2 pKa = 11.84TTYY5 pKa = 10.7EE6 pKa = 4.03SATVRR11 pKa = 11.84LYY13 pKa = 10.81HH14 pKa = 7.04LSDD17 pKa = 3.93GPEE20 pKa = 3.93GGAAQTLFYY29 pKa = 10.99GPLDD33 pKa = 3.47QAMALAAQQSEE44 pKa = 5.08DD45 pKa = 3.25IQADD49 pKa = 3.93LFIATDD55 pKa = 3.4NDD57 pKa = 3.61VIAWLDD63 pKa = 3.51LAEE66 pKa = 4.29GG67 pKa = 3.74
MM1 pKa = 7.12RR2 pKa = 11.84TTYY5 pKa = 10.7EE6 pKa = 4.03SATVRR11 pKa = 11.84LYY13 pKa = 10.81HH14 pKa = 7.04LSDD17 pKa = 3.93GPEE20 pKa = 3.93GGAAQTLFYY29 pKa = 10.99GPLDD33 pKa = 3.47QAMALAAQQSEE44 pKa = 5.08DD45 pKa = 3.25IQADD49 pKa = 3.93LFIATDD55 pKa = 3.4NDD57 pKa = 3.61VIAWLDD63 pKa = 3.51LAEE66 pKa = 4.29GG67 pKa = 3.74
Molecular weight: 7.25 kDa
Isoelectric point according different methods:
Protein with the highest isoelectric point:
>tr|A0A0N1AML8|A0A0N1AML8_9SPHN Divalent metal cation transporter MntH OS=Novosphingobium sp. AAP1 OX=1523413 GN=mntH PE=3 SV=1
MM1 pKa = 7.45KK2 pKa = 9.61RR3 pKa = 11.84TFQPSNLVRR12 pKa = 11.84ARR14 pKa = 11.84RR15 pKa = 11.84HH16 pKa = 4.37GFRR19 pKa = 11.84ARR21 pKa = 11.84MATVGGRR28 pKa = 11.84KK29 pKa = 8.11VLRR32 pKa = 11.84ARR34 pKa = 11.84RR35 pKa = 11.84ARR37 pKa = 11.84GRR39 pKa = 11.84KK40 pKa = 8.79NLSAA44 pKa = 4.73
MM1 pKa = 7.45KK2 pKa = 9.61RR3 pKa = 11.84TFQPSNLVRR12 pKa = 11.84ARR14 pKa = 11.84RR15 pKa = 11.84HH16 pKa = 4.37GFRR19 pKa = 11.84ARR21 pKa = 11.84MATVGGRR28 pKa = 11.84KK29 pKa = 8.11VLRR32 pKa = 11.84ARR34 pKa = 11.84RR35 pKa = 11.84ARR37 pKa = 11.84GRR39 pKa = 11.84KK40 pKa = 8.79NLSAA44 pKa = 4.73
Molecular weight: 5.09 kDa
Isoelectric point according different methods:
Peptides (in silico digests for buttom-up proteomics)
Below you can find in silico digests of the whole proteome with Trypsin, Chymotrypsin, Trypsin+LysC, LysN, ArgC proteases suitable for different mass spec machines.| Try ESI |
 |
|---|
| ChTry ESI |
|
|---|
| ArgC ESI |
|
|---|
| LysN ESI |
|
|---|
| TryLysC ESI |
|
|---|
| Try MALDI |
|
|---|
| ChTry MALDI |
|
|---|
| ArgC MALDI |
|
|---|
| LysN MALDI |
|
|---|
| TryLysC MALDI |
|
|---|
| Try LTQ |
|
|---|
| ChTry LTQ |
|
|---|
| ArgC LTQ |
|
|---|
| LysN LTQ |
|
|---|
| TryLysC LTQ |
|
|---|
| Try MSlow |
|
|---|
| ChTry MSlow |
|
|---|
| ArgC MSlow |
|
|---|
| LysN MSlow |
|
|---|
| TryLysC MSlow |
|
|---|
| Try MShigh |
|
|---|
| ChTry MShigh |
|
|---|
| ArgC MShigh |
|
|---|
| LysN MShigh |
|
|---|
| TryLysC MShigh |
|
|---|
General Statistics
Number of major isoforms |
Number of additional isoforms |
Number of all proteins |
Number of amino acids |
Min. Seq. Length |
Max. Seq. Length |
Avg. Seq. Length |
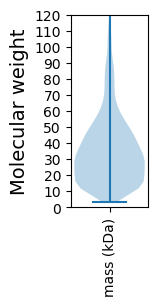
Avg. Mol. Weight |
|---|---|---|---|---|---|---|---|
0 |
1332680 |
29 |
3981 |
342.1 |
36.71 |
Amino acid frequency
Ala |
Cys |
Asp |
Glu |
Phe |
Gly |
His |
Ile |
Lys |
Leu |
|---|---|---|---|---|---|---|---|---|---|
14.481 ± 0.071 | 0.795 ± 0.012 |
5.791 ± 0.027 | 4.641 ± 0.038 |
3.433 ± 0.021 | 9.008 ± 0.04 |
2.213 ± 0.021 | 4.503 ± 0.023 |
2.577 ± 0.029 | 10.209 ± 0.048 |
Met |
Asn |
Gln |
Pro |
Arg |
Ser |
Thr |
Val |
Trp |
Tyr |
|---|---|---|---|---|---|---|---|---|---|
2.368 ± 0.019 | 2.502 ± 0.032 |
5.584 ± 0.033 | 3.511 ± 0.021 |
7.114 ± 0.038 | 4.822 ± 0.032 |
5.362 ± 0.037 | 7.375 ± 0.028 |
1.522 ± 0.019 | 2.188 ± 0.026 |
Most of the basic statistics you can see at this page can be downloaded from this CSV file
See this proteome in:

Proteome-pI is available under Creative Commons Attribution-NoDerivs license, for more details see here
| Reference: Kozlowski LP. Proteome-pI 2.0: Proteome Isoelectric Point Database Update. Nucleic Acids Res. 2021, doi: 10.1093/nar/gkab944 | Contact: Lukasz P. Kozlowski |