Streptococcus phage Javan122
Taxonomy: Viruses; Duplodnaviria; Heunggongvirae; Uroviricota; Caudoviricetes; Caudovirales; Siphoviridae; unclassified Siphoviridae
Average proteome isoelectric point is 6.1
Get precalculated fractions of proteins
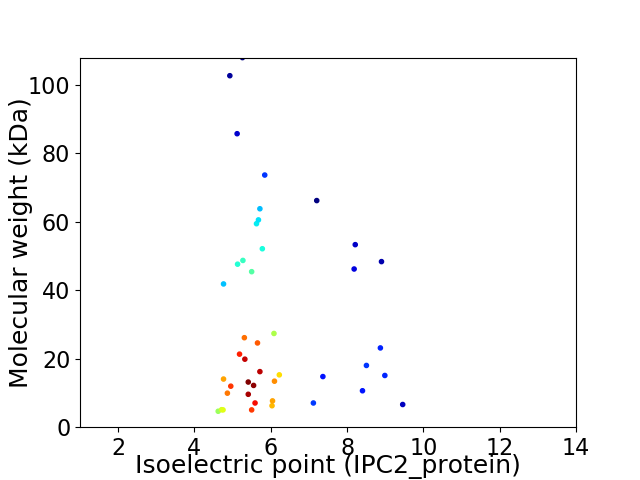
Virtual 2D-PAGE plot for 44 proteins (isoelectric point calculated using IPC2_protein)
Get csv file with sequences according to given criteria:
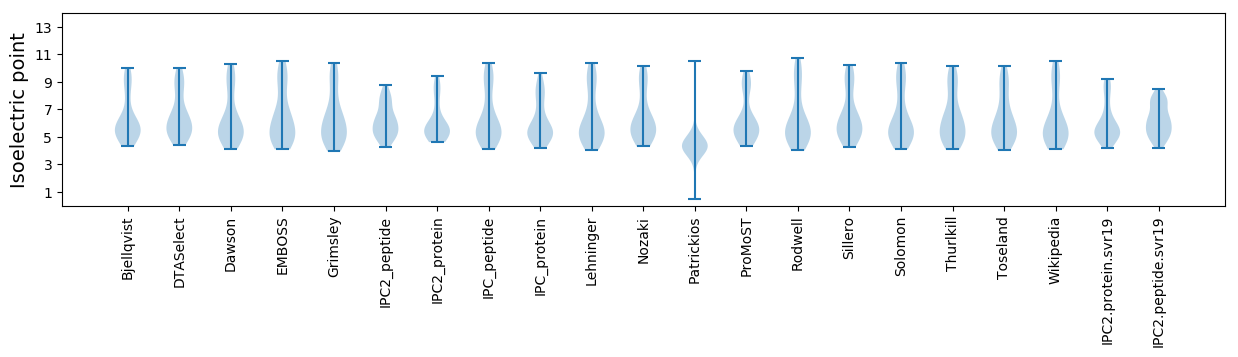
* You can choose from 21 different methods for calculating isoelectric point
Summary statistics related to proteome-wise predictions
Protein with the lowest isoelectric point:
>tr|A0A4D6APF6|A0A4D6APF6_9CAUD Homing endonuclease OS=Streptococcus phage Javan122 OX=2547989 GN=Javan122_0027 PE=4 SV=1
MM1 pKa = 7.63PVGLIPKK8 pKa = 8.79EE9 pKa = 3.83YY10 pKa = 10.12LVTSVRR16 pKa = 11.84CDD18 pKa = 3.45MVNDD22 pKa = 3.92CCLGQLTFGFALNTEE37 pKa = 4.13WMNFF41 pKa = 3.37
MM1 pKa = 7.63PVGLIPKK8 pKa = 8.79EE9 pKa = 3.83YY10 pKa = 10.12LVTSVRR16 pKa = 11.84CDD18 pKa = 3.45MVNDD22 pKa = 3.92CCLGQLTFGFALNTEE37 pKa = 4.13WMNFF41 pKa = 3.37
Molecular weight: 4.66 kDa
Isoelectric point according different methods:
Protein with the highest isoelectric point:
>tr|A0A4D6AQS0|A0A4D6AQS0_9CAUD Endopeptidase OS=Streptococcus phage Javan122 OX=2547989 GN=Javan122_0008 PE=4 SV=1
MM1 pKa = 7.72MYY3 pKa = 10.16TILTCTIMGLWVLIGLYY20 pKa = 9.77FGYY23 pKa = 8.1MTIRR27 pKa = 11.84DD28 pKa = 4.32DD29 pKa = 3.97IRR31 pKa = 11.84NEE33 pKa = 3.5MEE35 pKa = 3.56RR36 pKa = 11.84RR37 pKa = 11.84AKK39 pKa = 10.13RR40 pKa = 11.84KK41 pKa = 9.52KK42 pKa = 9.97EE43 pKa = 3.89KK44 pKa = 10.58LSQTPLSRR52 pKa = 11.84KK53 pKa = 9.68NNN55 pKa = 3.67
MM1 pKa = 7.72MYY3 pKa = 10.16TILTCTIMGLWVLIGLYY20 pKa = 9.77FGYY23 pKa = 8.1MTIRR27 pKa = 11.84DD28 pKa = 4.32DD29 pKa = 3.97IRR31 pKa = 11.84NEE33 pKa = 3.5MEE35 pKa = 3.56RR36 pKa = 11.84RR37 pKa = 11.84AKK39 pKa = 10.13RR40 pKa = 11.84KK41 pKa = 9.52KK42 pKa = 9.97EE43 pKa = 3.89KK44 pKa = 10.58LSQTPLSRR52 pKa = 11.84KK53 pKa = 9.68NNN55 pKa = 3.67
Molecular weight: 6.63 kDa
Isoelectric point according different methods:
Peptides (in silico digests for buttom-up proteomics)
Below you can find in silico digests of the whole proteome with Trypsin, Chymotrypsin, Trypsin+LysC, LysN, ArgC proteases suitable for different mass spec machines.| Try ESI |
 |
|---|
| ChTry ESI |
|
|---|
| ArgC ESI |
|
|---|
| LysN ESI |
|
|---|
| TryLysC ESI |
|
|---|
| Try MALDI |
|
|---|
| ChTry MALDI |
|
|---|
| ArgC MALDI |
|
|---|
| LysN MALDI |
|
|---|
| TryLysC MALDI |
|
|---|
| Try LTQ |
|
|---|
| ChTry LTQ |
|
|---|
| ArgC LTQ |
|
|---|
| LysN LTQ |
|
|---|
| TryLysC LTQ |
|
|---|
| Try MSlow |
|
|---|
| ChTry MSlow |
|
|---|
| ArgC MSlow |
|
|---|
| LysN MSlow |
|
|---|
| TryLysC MSlow |
|
|---|
| Try MShigh |
|
|---|
| ChTry MShigh |
|
|---|
| ArgC MShigh |
|
|---|
| LysN MShigh |
|
|---|
| TryLysC MShigh |
|
|---|
General Statistics
Number of major isoforms |
Number of additional isoforms |
Number of all proteins |
Number of amino acids |
Min. Seq. Length |
Max. Seq. Length |
Avg. Seq. Length |
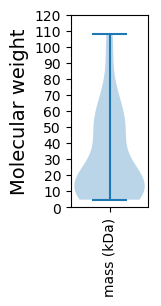
Avg. Mol. Weight |
|---|---|---|---|---|---|---|---|
0 |
12188 |
41 |
971 |
277.0 |
31.25 |
Amino acid frequency
Ala |
Cys |
Asp |
Glu |
Phe |
Gly |
His |
Ile |
Lys |
Leu |
|---|---|---|---|---|---|---|---|---|---|
6.474 ± 0.515 | 0.829 ± 0.117 |
5.776 ± 0.32 | 7.212 ± 0.344 |
4.037 ± 0.239 | 6.712 ± 0.331 |
1.895 ± 0.154 | 6.457 ± 0.392 |
6.925 ± 0.296 | 9.001 ± 0.244 |
Met |
Asn |
Gln |
Pro |
Arg |
Ser |
Thr |
Val |
Trp |
Tyr |
|---|---|---|---|---|---|---|---|---|---|
2.379 ± 0.14 | 4.939 ± 0.294 |
3.06 ± 0.187 | 4.373 ± 0.207 |
4.759 ± 0.259 | 7.13 ± 0.369 |
6.482 ± 0.455 | 6.408 ± 0.234 |
1.395 ± 0.107 | 3.758 ± 0.249 |
Most of the basic statistics you can see at this page can be downloaded from this CSV file
See this proteome in:

Proteome-pI is available under Creative Commons Attribution-NoDerivs license, for more details see here
| Reference: Kozlowski LP. Proteome-pI 2.0: Proteome Isoelectric Point Database Update. Nucleic Acids Res. 2021, doi: 10.1093/nar/gkab944 | Contact: Lukasz P. Kozlowski |