Streptococcus satellite phage Javan298
Taxonomy: Viruses; unclassified bacterial viruses
Average proteome isoelectric point is 5.57
Get precalculated fractions of proteins
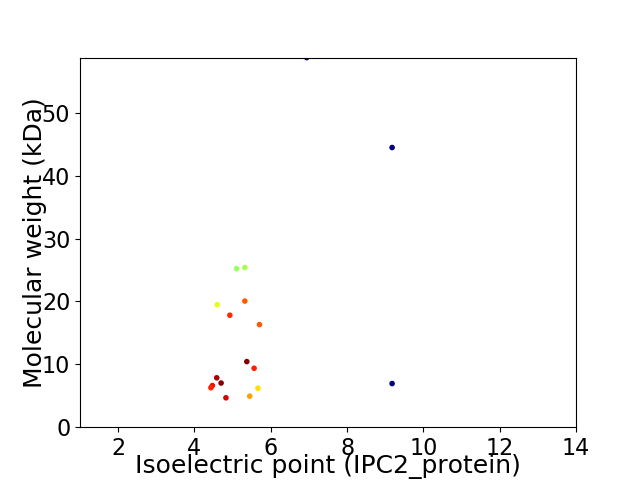
Virtual 2D-PAGE plot for 18 proteins (isoelectric point calculated using IPC2_protein)
Get csv file with sequences according to given criteria:
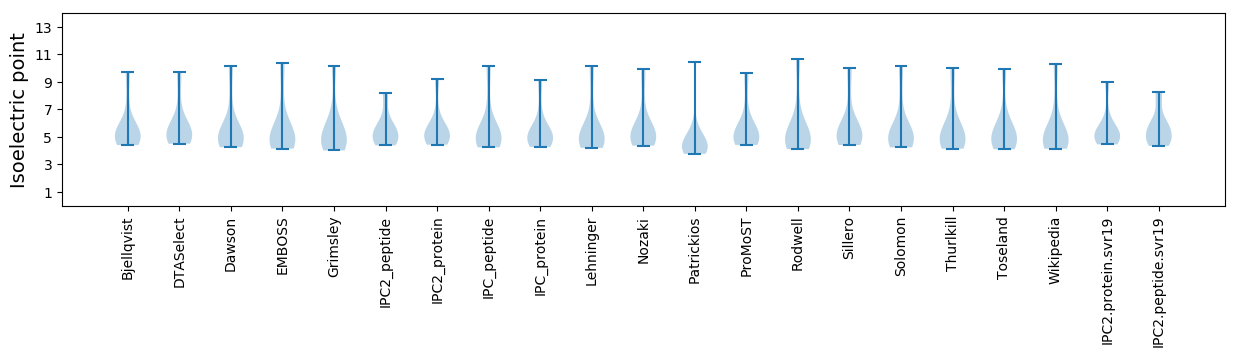
* You can choose from 21 different methods for calculating isoelectric point
Summary statistics related to proteome-wise predictions
Protein with the lowest isoelectric point:
>tr|A0A4D5ZIT3|A0A4D5ZIT3_9VIRU Uncharacterized protein OS=Streptococcus satellite phage Javan298 OX=2558617 GN=JavanS298_0008 PE=4 SV=1
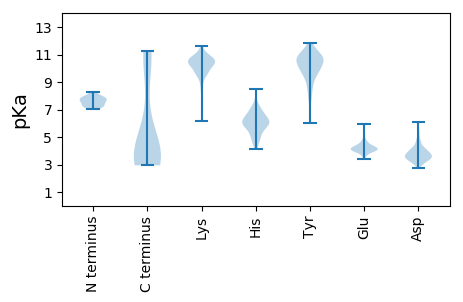
MM1 pKa = 7.66KK2 pKa = 10.3IKK4 pKa = 10.74LFYY7 pKa = 10.44QKK9 pKa = 10.61YY10 pKa = 8.31KK11 pKa = 10.71QSLEE15 pKa = 4.1DD16 pKa = 4.85FEE18 pKa = 5.91SQVNDD23 pKa = 3.44FMATVEE29 pKa = 4.3VVDD32 pKa = 3.98VKK34 pKa = 11.25YY35 pKa = 11.23SEE37 pKa = 4.27ATVGNSDD44 pKa = 5.52DD45 pKa = 4.23MDD47 pKa = 4.02TLTSVMVLYY56 pKa = 10.56KK57 pKa = 10.78
MM1 pKa = 7.66KK2 pKa = 10.3IKK4 pKa = 10.74LFYY7 pKa = 10.44QKK9 pKa = 10.61YY10 pKa = 8.31KK11 pKa = 10.71QSLEE15 pKa = 4.1DD16 pKa = 4.85FEE18 pKa = 5.91SQVNDD23 pKa = 3.44FMATVEE29 pKa = 4.3VVDD32 pKa = 3.98VKK34 pKa = 11.25YY35 pKa = 11.23SEE37 pKa = 4.27ATVGNSDD44 pKa = 5.52DD45 pKa = 4.23MDD47 pKa = 4.02TLTSVMVLYY56 pKa = 10.56KK57 pKa = 10.78
Molecular weight: 6.62 kDa
Isoelectric point according different methods:
Protein with the highest isoelectric point:
>tr|A0A4D5ZKM3|A0A4D5ZKM3_9VIRU Uncharacterized protein OS=Streptococcus satellite phage Javan298 OX=2558617 GN=JavanS298_0014 PE=4 SV=1
MM1 pKa = 7.86LITSTQAKK9 pKa = 9.74AIRR12 pKa = 11.84RR13 pKa = 11.84KK14 pKa = 9.66QADD17 pKa = 3.4KK18 pKa = 11.27KK19 pKa = 10.16LTAKK23 pKa = 10.18QAGEE27 pKa = 4.41EE28 pKa = 3.96IGVTQVTYY36 pKa = 10.88RR37 pKa = 11.84KK38 pKa = 9.3IRR40 pKa = 11.84DD41 pKa = 3.51GGEE44 pKa = 4.09VKK46 pKa = 10.52PSIYY50 pKa = 9.91QKK52 pKa = 11.14AMQWLAEE59 pKa = 4.48DD60 pKa = 4.07YY61 pKa = 11.23
MM1 pKa = 7.86LITSTQAKK9 pKa = 9.74AIRR12 pKa = 11.84RR13 pKa = 11.84KK14 pKa = 9.66QADD17 pKa = 3.4KK18 pKa = 11.27KK19 pKa = 10.16LTAKK23 pKa = 10.18QAGEE27 pKa = 4.41EE28 pKa = 3.96IGVTQVTYY36 pKa = 10.88RR37 pKa = 11.84KK38 pKa = 9.3IRR40 pKa = 11.84DD41 pKa = 3.51GGEE44 pKa = 4.09VKK46 pKa = 10.52PSIYY50 pKa = 9.91QKK52 pKa = 11.14AMQWLAEE59 pKa = 4.48DD60 pKa = 4.07YY61 pKa = 11.23
Molecular weight: 6.94 kDa
Isoelectric point according different methods:
Peptides (in silico digests for buttom-up proteomics)
Below you can find in silico digests of the whole proteome with Trypsin, Chymotrypsin, Trypsin+LysC, LysN, ArgC proteases suitable for different mass spec machines.| Try ESI |
 |
|---|
| ChTry ESI |
|
|---|
| ArgC ESI |
|
|---|
| LysN ESI |
|
|---|
| TryLysC ESI |
|
|---|
| Try MALDI |
|
|---|
| ChTry MALDI |
|
|---|
| ArgC MALDI |
|
|---|
| LysN MALDI |
|
|---|
| TryLysC MALDI |
|
|---|
| Try LTQ |
|
|---|
| ChTry LTQ |
|
|---|
| ArgC LTQ |
|
|---|
| LysN LTQ |
|
|---|
| TryLysC LTQ |
|
|---|
| Try MSlow |
|
|---|
| ChTry MSlow |
|
|---|
| ArgC MSlow |
|
|---|
| LysN MSlow |
|
|---|
| TryLysC MSlow |
|
|---|
| Try MShigh |
|
|---|
| ChTry MShigh |
|
|---|
| ArgC MShigh |
|
|---|
| LysN MShigh |
|
|---|
| TryLysC MShigh |
|
|---|
General Statistics
Number of major isoforms |
Number of additional isoforms |
Number of all proteins |
Number of amino acids |
Min. Seq. Length |
Max. Seq. Length |
Avg. Seq. Length |
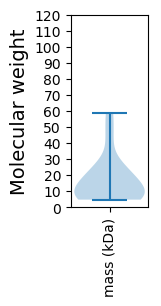
Avg. Mol. Weight |
|---|---|---|---|---|---|---|---|
0 |
2554 |
39 |
508 |
141.9 |
16.55 |
Amino acid frequency
Ala |
Cys |
Asp |
Glu |
Phe |
Gly |
His |
Ile |
Lys |
Leu |
|---|---|---|---|---|---|---|---|---|---|
5.756 ± 0.398 | 0.352 ± 0.115 |
6.578 ± 0.472 | 9.514 ± 1.048 |
4.307 ± 0.495 | 4.581 ± 0.312 |
1.527 ± 0.33 | 6.578 ± 0.452 |
9.593 ± 0.604 | 9.984 ± 0.454 |
Met |
Asn |
Gln |
Pro |
Arg |
Ser |
Thr |
Val |
Trp |
Tyr |
|---|---|---|---|---|---|---|---|---|---|
2.741 ± 0.423 | 5.795 ± 0.628 |
1.84 ± 0.21 | 4.464 ± 0.329 |
4.777 ± 0.239 | 4.973 ± 0.335 |
5.247 ± 0.646 | 5.521 ± 0.499 |
1.057 ± 0.178 | 4.816 ± 0.316 |
Most of the basic statistics you can see at this page can be downloaded from this CSV file
See this proteome in:

Proteome-pI is available under Creative Commons Attribution-NoDerivs license, for more details see here
| Reference: Kozlowski LP. Proteome-pI 2.0: Proteome Isoelectric Point Database Update. Nucleic Acids Res. 2021, doi: 10.1093/nar/gkab944 | Contact: Lukasz P. Kozlowski |