Staphylococcus phage PMBT8
Taxonomy: Viruses; Duplodnaviria; Heunggongvirae; Uroviricota; Caudoviricetes; Caudovirales; Siphoviridae; Sextaecvirus; unclassified Sextaecvirus
Average proteome isoelectric point is 6.38
Get precalculated fractions of proteins
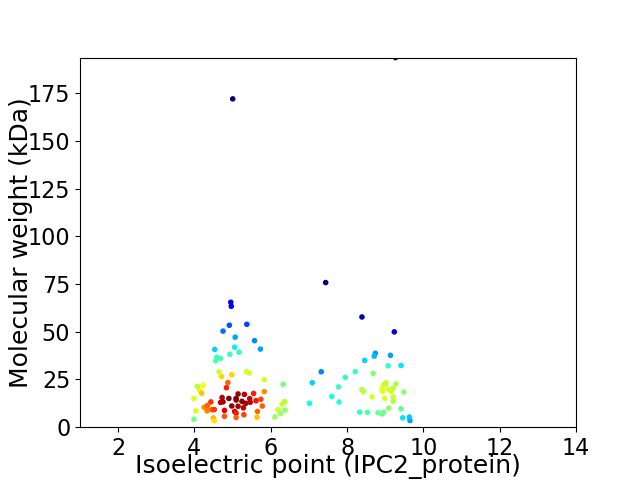
Virtual 2D-PAGE plot for 122 proteins (isoelectric point calculated using IPC2_protein)
Get csv file with sequences according to given criteria:
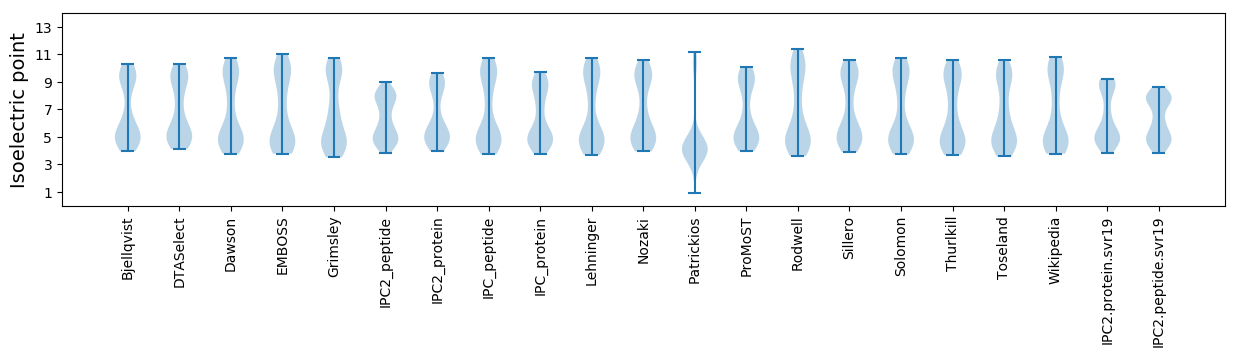
* You can choose from 21 different methods for calculating isoelectric point
Summary statistics related to proteome-wise predictions
Protein with the lowest isoelectric point:
>tr|A0A4Y6E7K4|A0A4Y6E7K4_9CAUD HNHc domain-containing protein OS=Staphylococcus phage PMBT8 OX=2590894 PE=4 SV=1
MM1 pKa = 6.9NTNIDD6 pKa = 3.63VLNRR10 pKa = 11.84MLNKK14 pKa = 10.16KK15 pKa = 9.79GLSLSLEE22 pKa = 4.3SMDD25 pKa = 4.43GLTTFSPDD33 pKa = 2.91AQTYY37 pKa = 7.11EE38 pKa = 4.24VNGITIIDD46 pKa = 4.04DD47 pKa = 3.57VTCYY51 pKa = 9.96FVEE54 pKa = 4.73HH55 pKa = 5.72YY56 pKa = 10.22VAYY59 pKa = 10.5DD60 pKa = 3.55EE61 pKa = 4.68IEE63 pKa = 4.11AMNIITEE70 pKa = 4.15LLEE73 pKa = 4.3EE74 pKa = 4.35KK75 pKa = 10.71
MM1 pKa = 6.9NTNIDD6 pKa = 3.63VLNRR10 pKa = 11.84MLNKK14 pKa = 10.16KK15 pKa = 9.79GLSLSLEE22 pKa = 4.3SMDD25 pKa = 4.43GLTTFSPDD33 pKa = 2.91AQTYY37 pKa = 7.11EE38 pKa = 4.24VNGITIIDD46 pKa = 4.04DD47 pKa = 3.57VTCYY51 pKa = 9.96FVEE54 pKa = 4.73HH55 pKa = 5.72YY56 pKa = 10.22VAYY59 pKa = 10.5DD60 pKa = 3.55EE61 pKa = 4.68IEE63 pKa = 4.11AMNIITEE70 pKa = 4.15LLEE73 pKa = 4.3EE74 pKa = 4.35KK75 pKa = 10.71
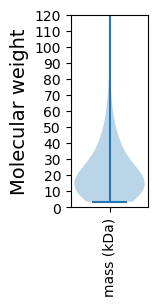
Molecular weight: 8.54 kDa
Isoelectric point according different methods:
Protein with the highest isoelectric point:
>tr|A0A4Y6EID1|A0A4Y6EID1_9CAUD Uncharacterized protein OS=Staphylococcus phage PMBT8 OX=2590894 PE=4 SV=1
MM1 pKa = 6.92IQKK4 pKa = 9.6ARR6 pKa = 11.84KK7 pKa = 8.68KK8 pKa = 8.99PVEE11 pKa = 4.11RR12 pKa = 11.84VVGTSTLTKK21 pKa = 10.33KK22 pKa = 10.35ILTTIYY28 pKa = 9.1CTLL31 pKa = 3.54
MM1 pKa = 6.92IQKK4 pKa = 9.6ARR6 pKa = 11.84KK7 pKa = 8.68KK8 pKa = 8.99PVEE11 pKa = 4.11RR12 pKa = 11.84VVGTSTLTKK21 pKa = 10.33KK22 pKa = 10.35ILTTIYY28 pKa = 9.1CTLL31 pKa = 3.54
Molecular weight: 3.52 kDa
Isoelectric point according different methods:
Peptides (in silico digests for buttom-up proteomics)
Below you can find in silico digests of the whole proteome with Trypsin, Chymotrypsin, Trypsin+LysC, LysN, ArgC proteases suitable for different mass spec machines.| Try ESI |
 |
|---|
| ChTry ESI |
|
|---|
| ArgC ESI |
|
|---|
| LysN ESI |
|
|---|
| TryLysC ESI |
|
|---|
| Try MALDI |
|
|---|
| ChTry MALDI |
|
|---|
| ArgC MALDI |
|
|---|
| LysN MALDI |
|
|---|
| TryLysC MALDI |
|
|---|
| Try LTQ |
|
|---|
| ChTry LTQ |
|
|---|
| ArgC LTQ |
|
|---|
| LysN LTQ |
|
|---|
| TryLysC LTQ |
|
|---|
| Try MSlow |
|
|---|
| ChTry MSlow |
|
|---|
| ArgC MSlow |
|
|---|
| LysN MSlow |
|
|---|
| TryLysC MSlow |
|
|---|
| Try MShigh |
|
|---|
| ChTry MShigh |
|
|---|
| ArgC MShigh |
|
|---|
| LysN MShigh |
|
|---|
| TryLysC MShigh |
|
|---|
General Statistics
Number of major isoforms |
Number of additional isoforms |
Number of all proteins |
Number of amino acids |
Min. Seq. Length |
Max. Seq. Length |
Avg. Seq. Length |
Avg. Mol. Weight |
|---|---|---|---|---|---|---|---|
0 |
24854 |
29 |
1759 |
203.7 |
23.54 |
Amino acid frequency
Ala |
Cys |
Asp |
Glu |
Phe |
Gly |
His |
Ile |
Lys |
Leu |
|---|---|---|---|---|---|---|---|---|---|
4.571 ± 0.376 | 0.825 ± 0.122 |
6.542 ± 0.243 | 7.785 ± 0.37 |
4.136 ± 0.175 | 5.701 ± 0.459 |
1.811 ± 0.103 | 7.854 ± 0.231 |
9.532 ± 0.272 | 8.152 ± 0.221 |
Met |
Asn |
Gln |
Pro |
Arg |
Ser |
Thr |
Val |
Trp |
Tyr |
|---|---|---|---|---|---|---|---|---|---|
2.7 ± 0.125 | 6.792 ± 0.153 |
2.189 ± 0.117 | 3.621 ± 0.15 |
4.201 ± 0.143 | 6.257 ± 0.161 |
5.335 ± 0.167 | 5.681 ± 0.18 |
1.09 ± 0.189 | 5.227 ± 0.284 |
Most of the basic statistics you can see at this page can be downloaded from this CSV file
See this proteome in:

Proteome-pI is available under Creative Commons Attribution-NoDerivs license, for more details see here
| Reference: Kozlowski LP. Proteome-pI 2.0: Proteome Isoelectric Point Database Update. Nucleic Acids Res. 2021, doi: 10.1093/nar/gkab944 | Contact: Lukasz P. Kozlowski |