Aspergillus udagawae
Taxonomy: cellular organisms; Eukaryota; Opisthokonta; Fungi; Dikarya; Ascomycota; saccharomyceta;
Average proteome isoelectric point is 6.39
Get precalculated fractions of proteins
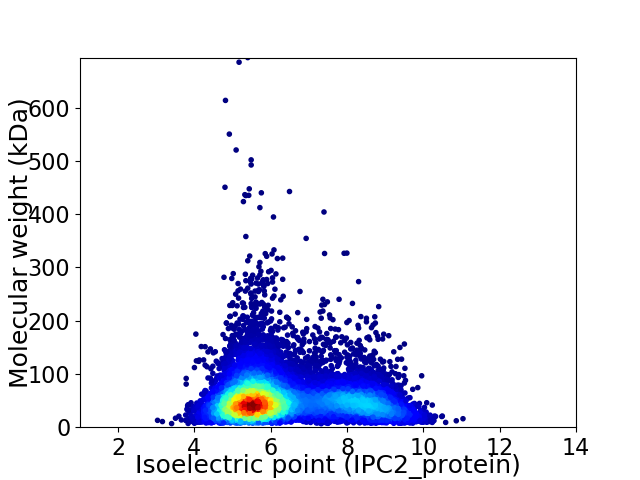
Virtual 2D-PAGE plot for 9999 proteins (isoelectric point calculated using IPC2_protein)
Get csv file with sequences according to given criteria:
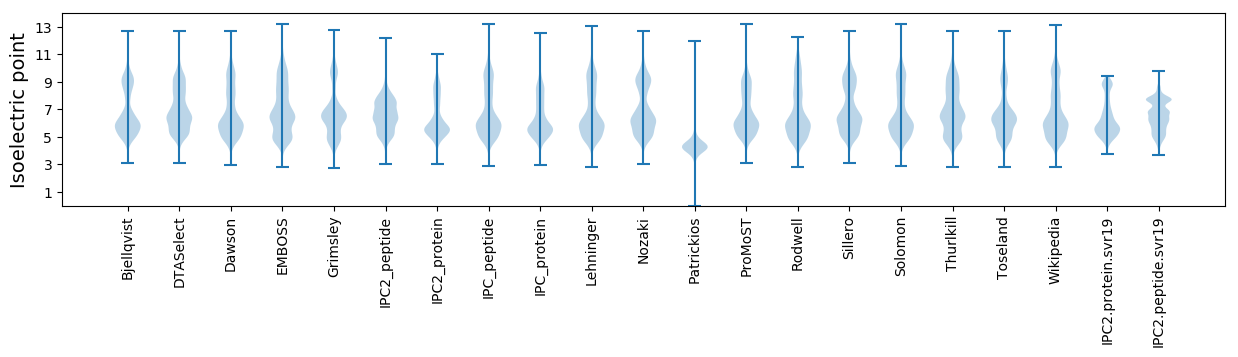
* You can choose from 21 different methods for calculating isoelectric point
Summary statistics related to proteome-wise predictions
Protein with the lowest isoelectric point:
>tr|A0A0K8LMY5|A0A0K8LMY5_9EURO Isoflavone reductase homolog IRL OS=Aspergillus udagawae OX=91492 GN=AUD_7924 PE=3 SV=1
MM1 pKa = 7.13VSPYY5 pKa = 8.29GTNYY9 pKa = 9.56FPALAAEE16 pKa = 4.38PTDD19 pKa = 4.13ATGHH23 pKa = 6.62LYY25 pKa = 10.11WSIINAWLLLTDD37 pKa = 4.57GATGSEE43 pKa = 4.64TPQPSQTIMLANWWWGLSTLSASCWFPCVIVLPPVTLPPMQAPVITSLIEE93 pKa = 4.11GFPKK97 pKa = 10.38TIMPPAAEE105 pKa = 4.39TPTLIVDD112 pKa = 5.4PITISGTPSILNAPTSTSVTIQFNYY137 pKa = 10.17SAIILPPFKK146 pKa = 11.24YY147 pKa = 9.83MDD149 pKa = 5.34DD150 pKa = 4.16DD151 pKa = 5.23DD152 pKa = 4.35GTILGSSSSNCWFLYY167 pKa = 10.02DD168 pKa = 4.08WPLKK172 pKa = 10.28IPSISISNSSLWPKK186 pKa = 10.56LDD188 pKa = 3.52TPQPPGLDD196 pKa = 3.32NNNDD200 pKa = 3.66DD201 pKa = 4.26EE202 pKa = 4.92EE203 pKa = 6.89GDD205 pKa = 3.56VHH207 pKa = 7.19EE208 pKa = 4.29YY209 pKa = 10.72HH210 pKa = 7.15LNNLLDD216 pKa = 5.73DD217 pKa = 6.06DD218 pKa = 6.37DD219 pKa = 7.7DD220 pKa = 7.66DD221 pKa = 7.74DD222 pKa = 7.71DD223 pKa = 7.7DD224 pKa = 7.44DD225 pKa = 6.89DD226 pKa = 6.61DD227 pKa = 5.5NNNHH231 pKa = 5.75NLKK234 pKa = 10.15LVSGTGSAWALSYY247 pKa = 10.03LTVTNDD253 pKa = 3.06PMFSAGVPVAVGGTYY268 pKa = 9.97TPTSQYY274 pKa = 11.31SIATKK279 pKa = 10.12PGTSSSIAAITSPATSRR296 pKa = 11.84LWPSISHH303 pKa = 6.15SLSISSITNVSKK315 pKa = 10.88SIRR318 pKa = 11.84QQ319 pKa = 3.36
MM1 pKa = 7.13VSPYY5 pKa = 8.29GTNYY9 pKa = 9.56FPALAAEE16 pKa = 4.38PTDD19 pKa = 4.13ATGHH23 pKa = 6.62LYY25 pKa = 10.11WSIINAWLLLTDD37 pKa = 4.57GATGSEE43 pKa = 4.64TPQPSQTIMLANWWWGLSTLSASCWFPCVIVLPPVTLPPMQAPVITSLIEE93 pKa = 4.11GFPKK97 pKa = 10.38TIMPPAAEE105 pKa = 4.39TPTLIVDD112 pKa = 5.4PITISGTPSILNAPTSTSVTIQFNYY137 pKa = 10.17SAIILPPFKK146 pKa = 11.24YY147 pKa = 9.83MDD149 pKa = 5.34DD150 pKa = 4.16DD151 pKa = 5.23DD152 pKa = 4.35GTILGSSSSNCWFLYY167 pKa = 10.02DD168 pKa = 4.08WPLKK172 pKa = 10.28IPSISISNSSLWPKK186 pKa = 10.56LDD188 pKa = 3.52TPQPPGLDD196 pKa = 3.32NNNDD200 pKa = 3.66DD201 pKa = 4.26EE202 pKa = 4.92EE203 pKa = 6.89GDD205 pKa = 3.56VHH207 pKa = 7.19EE208 pKa = 4.29YY209 pKa = 10.72HH210 pKa = 7.15LNNLLDD216 pKa = 5.73DD217 pKa = 6.06DD218 pKa = 6.37DD219 pKa = 7.7DD220 pKa = 7.66DD221 pKa = 7.74DD222 pKa = 7.71DD223 pKa = 7.7DD224 pKa = 7.44DD225 pKa = 6.89DD226 pKa = 6.61DD227 pKa = 5.5NNNHH231 pKa = 5.75NLKK234 pKa = 10.15LVSGTGSAWALSYY247 pKa = 10.03LTVTNDD253 pKa = 3.06PMFSAGVPVAVGGTYY268 pKa = 9.97TPTSQYY274 pKa = 11.31SIATKK279 pKa = 10.12PGTSSSIAAITSPATSRR296 pKa = 11.84LWPSISHH303 pKa = 6.15SLSISSITNVSKK315 pKa = 10.88SIRR318 pKa = 11.84QQ319 pKa = 3.36
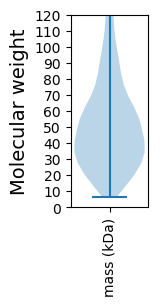
Molecular weight: 34.34 kDa
Isoelectric point according different methods:
Protein with the highest isoelectric point:
>tr|A0A0K8L6U3|A0A0K8L6U3_9EURO Putative ATP-dependent RNA helicase PB1A10.06c OS=Aspergillus udagawae OX=91492 GN=AUD_3006 PE=4 SV=1
MM1 pKa = 7.67SDD3 pKa = 3.26SLRR6 pKa = 11.84LGDD9 pKa = 3.47HH10 pKa = 6.14HH11 pKa = 7.37RR12 pKa = 11.84LRR14 pKa = 11.84NIQRR18 pKa = 11.84AVPSALRR25 pKa = 11.84TAMRR29 pKa = 11.84SQPFRR34 pKa = 11.84LPAQTLTTSLSTPLRR49 pKa = 11.84TFSSALRR56 pKa = 11.84SQPTPLTQSLPSFRR70 pKa = 11.84TSLTSASSLSFGLTQQTRR88 pKa = 11.84SFSASASLAGRR99 pKa = 11.84RR100 pKa = 11.84ATYY103 pKa = 9.91NPSRR107 pKa = 11.84RR108 pKa = 11.84VQKK111 pKa = 10.2RR112 pKa = 11.84RR113 pKa = 11.84HH114 pKa = 5.33GFLARR119 pKa = 11.84LRR121 pKa = 11.84SRR123 pKa = 11.84GGRR126 pKa = 11.84KK127 pKa = 8.87VLQHH131 pKa = 6.19RR132 pKa = 11.84RR133 pKa = 11.84AKK135 pKa = 9.96GRR137 pKa = 11.84KK138 pKa = 7.78SLSWW142 pKa = 3.4
MM1 pKa = 7.67SDD3 pKa = 3.26SLRR6 pKa = 11.84LGDD9 pKa = 3.47HH10 pKa = 6.14HH11 pKa = 7.37RR12 pKa = 11.84LRR14 pKa = 11.84NIQRR18 pKa = 11.84AVPSALRR25 pKa = 11.84TAMRR29 pKa = 11.84SQPFRR34 pKa = 11.84LPAQTLTTSLSTPLRR49 pKa = 11.84TFSSALRR56 pKa = 11.84SQPTPLTQSLPSFRR70 pKa = 11.84TSLTSASSLSFGLTQQTRR88 pKa = 11.84SFSASASLAGRR99 pKa = 11.84RR100 pKa = 11.84ATYY103 pKa = 9.91NPSRR107 pKa = 11.84RR108 pKa = 11.84VQKK111 pKa = 10.2RR112 pKa = 11.84RR113 pKa = 11.84HH114 pKa = 5.33GFLARR119 pKa = 11.84LRR121 pKa = 11.84SRR123 pKa = 11.84GGRR126 pKa = 11.84KK127 pKa = 8.87VLQHH131 pKa = 6.19RR132 pKa = 11.84RR133 pKa = 11.84AKK135 pKa = 9.96GRR137 pKa = 11.84KK138 pKa = 7.78SLSWW142 pKa = 3.4
Molecular weight: 15.93 kDa
Isoelectric point according different methods:
Peptides (in silico digests for buttom-up proteomics)
Below you can find in silico digests of the whole proteome with Trypsin, Chymotrypsin, Trypsin+LysC, LysN, ArgC proteases suitable for different mass spec machines.| Try ESI |
 |
|---|
| ChTry ESI |
|
|---|
| ArgC ESI |
|
|---|
| LysN ESI |
|
|---|
| TryLysC ESI |
|
|---|
| Try MALDI |
|
|---|
| ChTry MALDI |
|
|---|
| ArgC MALDI |
|
|---|
| LysN MALDI |
|
|---|
| TryLysC MALDI |
|
|---|
| Try LTQ |
|
|---|
| ChTry LTQ |
|
|---|
| ArgC LTQ |
|
|---|
| LysN LTQ |
|
|---|
| TryLysC LTQ |
|
|---|
| Try MSlow |
|
|---|
| ChTry MSlow |
|
|---|
| ArgC MSlow |
|
|---|
| LysN MSlow |
|
|---|
| TryLysC MSlow |
|
|---|
| Try MShigh |
|
|---|
| ChTry MShigh |
|
|---|
| ArgC MShigh |
|
|---|
| LysN MShigh |
|
|---|
| TryLysC MShigh |
|
|---|
General Statistics
Number of major isoforms |
Number of additional isoforms |
Number of all proteins |
Number of amino acids |
Min. Seq. Length |
Max. Seq. Length |
Avg. Seq. Length |
Avg. Mol. Weight |
|---|---|---|---|---|---|---|---|
0 |
5324289 |
66 |
6233 |
532.5 |
58.95 |
Amino acid frequency
Ala |
Cys |
Asp |
Glu |
Phe |
Gly |
His |
Ile |
Lys |
Leu |
|---|---|---|---|---|---|---|---|---|---|
8.701 ± 0.022 | 1.241 ± 0.009 |
5.615 ± 0.016 | 6.139 ± 0.023 |
3.749 ± 0.013 | 6.775 ± 0.023 |
2.408 ± 0.008 | 4.957 ± 0.015 |
4.58 ± 0.021 | 9.183 ± 0.024 |
Met |
Asn |
Gln |
Pro |
Arg |
Ser |
Thr |
Val |
Trp |
Tyr |
|---|---|---|---|---|---|---|---|---|---|
2.115 ± 0.007 | 3.605 ± 0.012 |
5.952 ± 0.024 | 4.06 ± 0.017 |
6.169 ± 0.02 | 8.274 ± 0.03 |
5.879 ± 0.014 | 6.277 ± 0.016 |
1.479 ± 0.009 | 2.842 ± 0.012 |
Most of the basic statistics you can see at this page can be downloaded from this CSV file
See this proteome in:

Proteome-pI is available under Creative Commons Attribution-NoDerivs license, for more details see here
| Reference: Kozlowski LP. Proteome-pI 2.0: Proteome Isoelectric Point Database Update. Nucleic Acids Res. 2021, doi: 10.1093/nar/gkab944 | Contact: Lukasz P. Kozlowski |