Novosphingobium sp. Leaf2
Taxonomy: cellular organisms; Bacteria; Proteobacteria; Alphaproteobacteria; Sphingomonadales; Sphingomonadaceae; Novosphingobium; unclassified Novosphingobium
Average proteome isoelectric point is 6.57
Get precalculated fractions of proteins
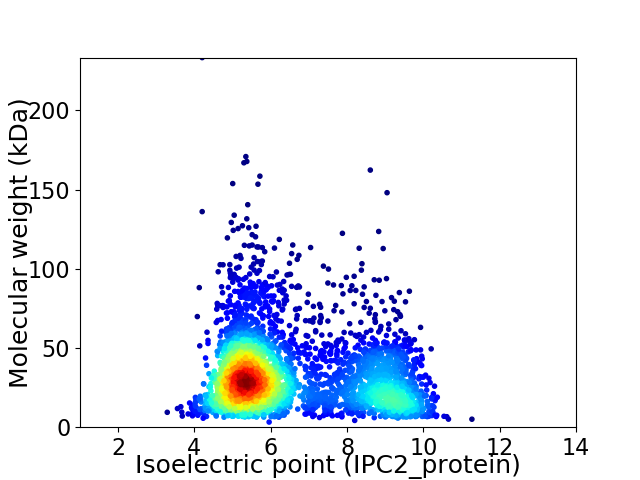
Virtual 2D-PAGE plot for 3387 proteins (isoelectric point calculated using IPC2_protein)
Get csv file with sequences according to given criteria:
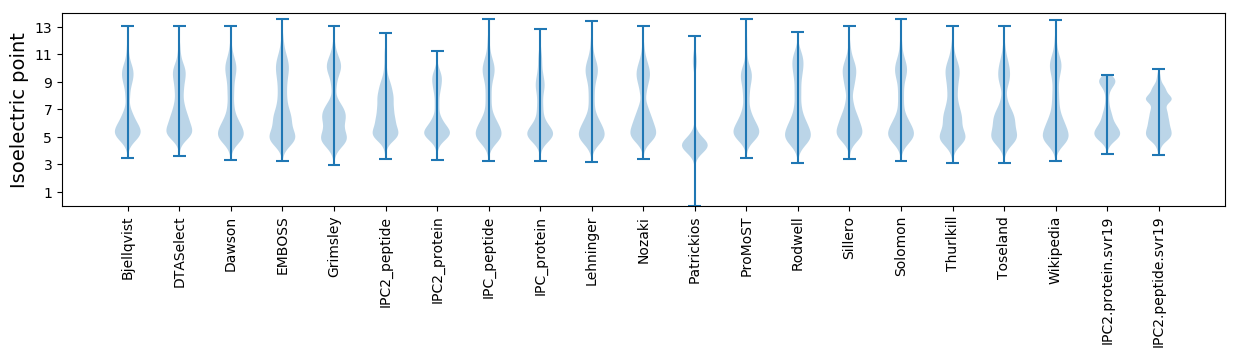
* You can choose from 21 different methods for calculating isoelectric point
Summary statistics related to proteome-wise predictions
Protein with the lowest isoelectric point:
>tr|A0A0Q4C7R6|A0A0Q4C7R6_9SPHN Uncharacterized protein OS=Novosphingobium sp. Leaf2 OX=1735670 GN=ASE49_16955 PE=4 SV=1
MM1 pKa = 7.48RR2 pKa = 11.84TTAQDD7 pKa = 3.07ASVRR11 pKa = 11.84LYY13 pKa = 10.85HH14 pKa = 7.15LDD16 pKa = 3.59AGPEE20 pKa = 3.78GGAAITLLYY29 pKa = 10.74GSLADD34 pKa = 4.21AMVLAAQQDD43 pKa = 3.99EE44 pKa = 4.42ATQEE48 pKa = 4.18GLFIATDD55 pKa = 3.68NDD57 pKa = 3.33VVAYY61 pKa = 10.53LDD63 pKa = 4.63LVDD66 pKa = 4.22AA67 pKa = 5.46
MM1 pKa = 7.48RR2 pKa = 11.84TTAQDD7 pKa = 3.07ASVRR11 pKa = 11.84LYY13 pKa = 10.85HH14 pKa = 7.15LDD16 pKa = 3.59AGPEE20 pKa = 3.78GGAAITLLYY29 pKa = 10.74GSLADD34 pKa = 4.21AMVLAAQQDD43 pKa = 3.99EE44 pKa = 4.42ATQEE48 pKa = 4.18GLFIATDD55 pKa = 3.68NDD57 pKa = 3.33VVAYY61 pKa = 10.53LDD63 pKa = 4.63LVDD66 pKa = 4.22AA67 pKa = 5.46
Molecular weight: 7.03 kDa
Isoelectric point according different methods:
Protein with the highest isoelectric point:
>tr|A0A0Q4BUS2|A0A0Q4BUS2_9SPHN LysR family transcriptional regulator OS=Novosphingobium sp. Leaf2 OX=1735670 GN=ASE49_05690 PE=3 SV=1
MM1 pKa = 7.45KK2 pKa = 9.61RR3 pKa = 11.84TFQPSNLVRR12 pKa = 11.84ARR14 pKa = 11.84RR15 pKa = 11.84HH16 pKa = 4.64GFRR19 pKa = 11.84SRR21 pKa = 11.84TATVGGRR28 pKa = 11.84KK29 pKa = 8.17VLRR32 pKa = 11.84ARR34 pKa = 11.84RR35 pKa = 11.84ARR37 pKa = 11.84GRR39 pKa = 11.84SKK41 pKa = 11.12LSAA44 pKa = 3.81
MM1 pKa = 7.45KK2 pKa = 9.61RR3 pKa = 11.84TFQPSNLVRR12 pKa = 11.84ARR14 pKa = 11.84RR15 pKa = 11.84HH16 pKa = 4.64GFRR19 pKa = 11.84SRR21 pKa = 11.84TATVGGRR28 pKa = 11.84KK29 pKa = 8.17VLRR32 pKa = 11.84ARR34 pKa = 11.84RR35 pKa = 11.84ARR37 pKa = 11.84GRR39 pKa = 11.84SKK41 pKa = 11.12LSAA44 pKa = 3.81
Molecular weight: 5.05 kDa
Isoelectric point according different methods:
Peptides (in silico digests for buttom-up proteomics)
Below you can find in silico digests of the whole proteome with Trypsin, Chymotrypsin, Trypsin+LysC, LysN, ArgC proteases suitable for different mass spec machines.| Try ESI |
 |
|---|
| ChTry ESI |
|
|---|
| ArgC ESI |
|
|---|
| LysN ESI |
|
|---|
| TryLysC ESI |
|
|---|
| Try MALDI |
|
|---|
| ChTry MALDI |
|
|---|
| ArgC MALDI |
|
|---|
| LysN MALDI |
|
|---|
| TryLysC MALDI |
|
|---|
| Try LTQ |
|
|---|
| ChTry LTQ |
|
|---|
| ArgC LTQ |
|
|---|
| LysN LTQ |
|
|---|
| TryLysC LTQ |
|
|---|
| Try MSlow |
|
|---|
| ChTry MSlow |
|
|---|
| ArgC MSlow |
|
|---|
| LysN MSlow |
|
|---|
| TryLysC MSlow |
|
|---|
| Try MShigh |
|
|---|
| ChTry MShigh |
|
|---|
| ArgC MShigh |
|
|---|
| LysN MShigh |
|
|---|
| TryLysC MShigh |
|
|---|
General Statistics
Number of major isoforms |
Number of additional isoforms |
Number of all proteins |
Number of amino acids |
Min. Seq. Length |
Max. Seq. Length |
Avg. Seq. Length |
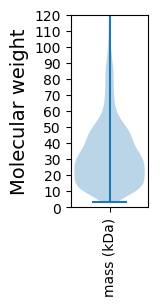
Avg. Mol. Weight |
|---|---|---|---|---|---|---|---|
0 |
1086820 |
29 |
2369 |
320.9 |
34.6 |
Amino acid frequency
Ala |
Cys |
Asp |
Glu |
Phe |
Gly |
His |
Ile |
Lys |
Leu |
|---|---|---|---|---|---|---|---|---|---|
13.477 ± 0.066 | 0.829 ± 0.012 |
6.003 ± 0.034 | 4.988 ± 0.041 |
3.518 ± 0.022 | 8.883 ± 0.045 |
2.089 ± 0.025 | 4.912 ± 0.029 |
2.958 ± 0.033 | 9.816 ± 0.05 |
Met |
Asn |
Gln |
Pro |
Arg |
Ser |
Thr |
Val |
Trp |
Tyr |
|---|---|---|---|---|---|---|---|---|---|
2.474 ± 0.019 | 2.582 ± 0.026 |
5.372 ± 0.035 | 3.338 ± 0.026 |
7.104 ± 0.039 | 5.171 ± 0.032 |
5.47 ± 0.039 | 7.336 ± 0.033 |
1.422 ± 0.018 | 2.256 ± 0.024 |
Most of the basic statistics you can see at this page can be downloaded from this CSV file
See this proteome in:

Proteome-pI is available under Creative Commons Attribution-NoDerivs license, for more details see here
| Reference: Kozlowski LP. Proteome-pI 2.0: Proteome Isoelectric Point Database Update. Nucleic Acids Res. 2021, doi: 10.1093/nar/gkab944 | Contact: Lukasz P. Kozlowski |