Simian adenovirus 49
Taxonomy: Viruses; Varidnaviria; Bamfordvirae; Preplasmiviricota; Tectiliviricetes; Rowavirales; Adenoviridae; Mastadenovirus; Simian mastadenovirus B
Average proteome isoelectric point is 6.85
Get precalculated fractions of proteins
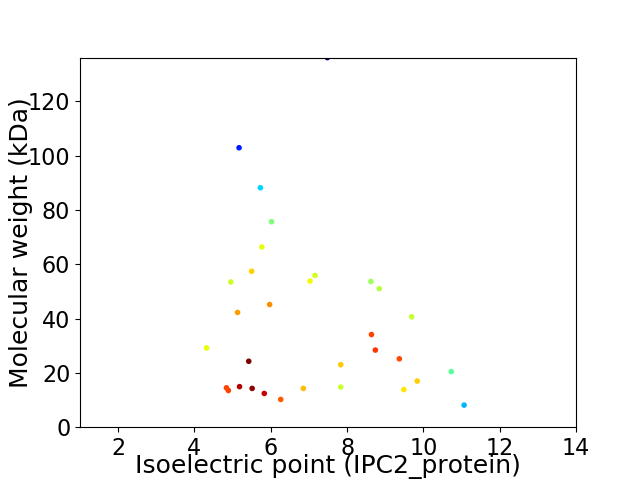
Virtual 2D-PAGE plot for 32 proteins (isoelectric point calculated using IPC2_protein)
Get csv file with sequences according to given criteria:
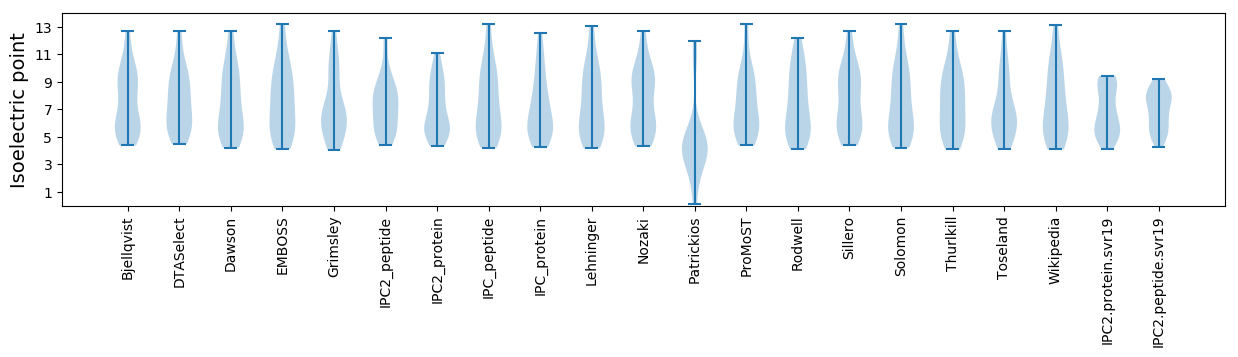
* You can choose from 21 different methods for calculating isoelectric point
Summary statistics related to proteome-wise predictions
Protein with the lowest isoelectric point:
>tr|F2WTJ7|F2WTJ7_9ADEN E1B protein small T-antigen OS=Simian adenovirus 49 OX=995022 PE=3 SV=1
MM1 pKa = 7.0KK2 pKa = 9.53TWGLDD7 pKa = 3.14CGLYY11 pKa = 9.18PQEE14 pKa = 3.58VDD16 pKa = 2.4EE17 pKa = 4.49WLRR20 pKa = 11.84TEE22 pKa = 4.05YY23 pKa = 10.86CPTPGYY29 pKa = 10.42YY30 pKa = 10.54GEE32 pKa = 4.46NLSLHH37 pKa = 6.87DD38 pKa = 5.51LYY40 pKa = 11.22DD41 pKa = 4.31IDD43 pKa = 4.54VDD45 pKa = 4.07APADD49 pKa = 3.66GDD51 pKa = 4.01EE52 pKa = 4.69NEE54 pKa = 4.39VPVNDD59 pKa = 5.0FFPDD63 pKa = 3.6SLLLAVDD70 pKa = 3.7EE71 pKa = 5.48GIEE74 pKa = 4.12VDD76 pKa = 4.46YY77 pKa = 10.27PPPLDD82 pKa = 3.78TPGEE86 pKa = 4.06PSGSHH91 pKa = 6.62FMPDD95 pKa = 3.13LSAEE99 pKa = 4.13EE100 pKa = 3.93VDD102 pKa = 5.15LYY104 pKa = 10.87CHH106 pKa = 6.96EE107 pKa = 5.83DD108 pKa = 3.54GFPPSDD114 pKa = 3.72SEE116 pKa = 4.73GEE118 pKa = 3.84QSEE121 pKa = 4.17ARR123 pKa = 11.84EE124 pKa = 4.0EE125 pKa = 3.95RR126 pKa = 11.84LMAEE130 pKa = 4.36AAATGAAAAARR141 pKa = 11.84RR142 pKa = 11.84AWEE145 pKa = 4.02EE146 pKa = 3.72EE147 pKa = 4.28EE148 pKa = 4.97FRR150 pKa = 11.84LDD152 pKa = 3.87CPVLPGHH159 pKa = 6.75GCASCDD165 pKa = 3.6YY166 pKa = 10.14HH167 pKa = 7.61RR168 pKa = 11.84KK169 pKa = 7.47TSGFPEE175 pKa = 4.42IMCSLCYY182 pKa = 10.31LRR184 pKa = 11.84AHH186 pKa = 6.23GMFVYY191 pKa = 10.59SPVSDD196 pKa = 4.25AEE198 pKa = 4.36GEE200 pKa = 4.05PDD202 pKa = 3.28STTGHH207 pKa = 5.96SGGPGSPPKK216 pKa = 10.46LHH218 pKa = 5.97NTPPRR223 pKa = 11.84NVPRR227 pKa = 11.84PVPLRR232 pKa = 11.84VSGVRR237 pKa = 11.84RR238 pKa = 11.84AAVEE242 pKa = 4.17SLHH245 pKa = 7.17DD246 pKa = 4.69LIGGEE251 pKa = 4.18EE252 pKa = 4.19EE253 pKa = 4.24QVVPLDD259 pKa = 4.32LSAKK263 pKa = 9.66RR264 pKa = 11.84PRR266 pKa = 11.84HH267 pKa = 4.71
MM1 pKa = 7.0KK2 pKa = 9.53TWGLDD7 pKa = 3.14CGLYY11 pKa = 9.18PQEE14 pKa = 3.58VDD16 pKa = 2.4EE17 pKa = 4.49WLRR20 pKa = 11.84TEE22 pKa = 4.05YY23 pKa = 10.86CPTPGYY29 pKa = 10.42YY30 pKa = 10.54GEE32 pKa = 4.46NLSLHH37 pKa = 6.87DD38 pKa = 5.51LYY40 pKa = 11.22DD41 pKa = 4.31IDD43 pKa = 4.54VDD45 pKa = 4.07APADD49 pKa = 3.66GDD51 pKa = 4.01EE52 pKa = 4.69NEE54 pKa = 4.39VPVNDD59 pKa = 5.0FFPDD63 pKa = 3.6SLLLAVDD70 pKa = 3.7EE71 pKa = 5.48GIEE74 pKa = 4.12VDD76 pKa = 4.46YY77 pKa = 10.27PPPLDD82 pKa = 3.78TPGEE86 pKa = 4.06PSGSHH91 pKa = 6.62FMPDD95 pKa = 3.13LSAEE99 pKa = 4.13EE100 pKa = 3.93VDD102 pKa = 5.15LYY104 pKa = 10.87CHH106 pKa = 6.96EE107 pKa = 5.83DD108 pKa = 3.54GFPPSDD114 pKa = 3.72SEE116 pKa = 4.73GEE118 pKa = 3.84QSEE121 pKa = 4.17ARR123 pKa = 11.84EE124 pKa = 4.0EE125 pKa = 3.95RR126 pKa = 11.84LMAEE130 pKa = 4.36AAATGAAAAARR141 pKa = 11.84RR142 pKa = 11.84AWEE145 pKa = 4.02EE146 pKa = 3.72EE147 pKa = 4.28EE148 pKa = 4.97FRR150 pKa = 11.84LDD152 pKa = 3.87CPVLPGHH159 pKa = 6.75GCASCDD165 pKa = 3.6YY166 pKa = 10.14HH167 pKa = 7.61RR168 pKa = 11.84KK169 pKa = 7.47TSGFPEE175 pKa = 4.42IMCSLCYY182 pKa = 10.31LRR184 pKa = 11.84AHH186 pKa = 6.23GMFVYY191 pKa = 10.59SPVSDD196 pKa = 4.25AEE198 pKa = 4.36GEE200 pKa = 4.05PDD202 pKa = 3.28STTGHH207 pKa = 5.96SGGPGSPPKK216 pKa = 10.46LHH218 pKa = 5.97NTPPRR223 pKa = 11.84NVPRR227 pKa = 11.84PVPLRR232 pKa = 11.84VSGVRR237 pKa = 11.84RR238 pKa = 11.84AAVEE242 pKa = 4.17SLHH245 pKa = 7.17DD246 pKa = 4.69LIGGEE251 pKa = 4.18EE252 pKa = 4.19EE253 pKa = 4.24QVVPLDD259 pKa = 4.32LSAKK263 pKa = 9.66RR264 pKa = 11.84PRR266 pKa = 11.84HH267 pKa = 4.71
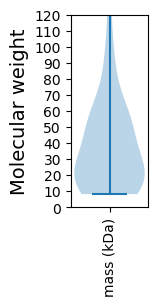
Molecular weight: 29.22 kDa
Isoelectric point according different methods:
Protein with the highest isoelectric point:
>tr|F2WTL0|F2WTL0_9ADEN Hexon protein OS=Simian adenovirus 49 OX=995022 GN=L3 PE=2 SV=1
MM1 pKa = 7.74ALTCRR6 pKa = 11.84VRR8 pKa = 11.84IPVPGYY14 pKa = 9.27RR15 pKa = 11.84GRR17 pKa = 11.84SHH19 pKa = 6.73RR20 pKa = 11.84RR21 pKa = 11.84HH22 pKa = 5.65RR23 pKa = 11.84RR24 pKa = 11.84GLAGRR29 pKa = 11.84GLRR32 pKa = 11.84RR33 pKa = 11.84RR34 pKa = 11.84RR35 pKa = 11.84AVRR38 pKa = 11.84RR39 pKa = 11.84RR40 pKa = 11.84MRR42 pKa = 11.84GGVLPLLIPLIAAAIGAVPGIASVALQASRR72 pKa = 11.84KK73 pKa = 7.38NN74 pKa = 3.5
MM1 pKa = 7.74ALTCRR6 pKa = 11.84VRR8 pKa = 11.84IPVPGYY14 pKa = 9.27RR15 pKa = 11.84GRR17 pKa = 11.84SHH19 pKa = 6.73RR20 pKa = 11.84RR21 pKa = 11.84HH22 pKa = 5.65RR23 pKa = 11.84RR24 pKa = 11.84GLAGRR29 pKa = 11.84GLRR32 pKa = 11.84RR33 pKa = 11.84RR34 pKa = 11.84RR35 pKa = 11.84AVRR38 pKa = 11.84RR39 pKa = 11.84RR40 pKa = 11.84MRR42 pKa = 11.84GGVLPLLIPLIAAAIGAVPGIASVALQASRR72 pKa = 11.84KK73 pKa = 7.38NN74 pKa = 3.5
Molecular weight: 8.14 kDa
Isoelectric point according different methods:
Peptides (in silico digests for buttom-up proteomics)
Below you can find in silico digests of the whole proteome with Trypsin, Chymotrypsin, Trypsin+LysC, LysN, ArgC proteases suitable for different mass spec machines.| Try ESI |
 |
|---|
| ChTry ESI |
|
|---|
| ArgC ESI |
|
|---|
| LysN ESI |
|
|---|
| TryLysC ESI |
|
|---|
| Try MALDI |
|
|---|
| ChTry MALDI |
|
|---|
| ArgC MALDI |
|
|---|
| LysN MALDI |
|
|---|
| TryLysC MALDI |
|
|---|
| Try LTQ |
|
|---|
| ChTry LTQ |
|
|---|
| ArgC LTQ |
|
|---|
| LysN LTQ |
|
|---|
| TryLysC LTQ |
|
|---|
| Try MSlow |
|
|---|
| ChTry MSlow |
|
|---|
| ArgC MSlow |
|
|---|
| LysN MSlow |
|
|---|
| TryLysC MSlow |
|
|---|
| Try MShigh |
|
|---|
| ChTry MShigh |
|
|---|
| ArgC MShigh |
|
|---|
| LysN MShigh |
|
|---|
| TryLysC MShigh |
|
|---|
General Statistics
Number of major isoforms |
Number of additional isoforms |
Number of all proteins |
Number of amino acids |
Min. Seq. Length |
Max. Seq. Length |
Avg. Seq. Length |
Avg. Mol. Weight |
|---|---|---|---|---|---|---|---|
11246 |
74 |
1201 |
351.4 |
39.24 |
Amino acid frequency
Ala |
Cys |
Asp |
Glu |
Phe |
Gly |
His |
Ile |
Lys |
Leu |
|---|---|---|---|---|---|---|---|---|---|
9.257 ± 0.503 | 1.858 ± 0.296 |
4.571 ± 0.321 | 5.887 ± 0.476 |
3.672 ± 0.203 | 6.216 ± 0.356 |
2.392 ± 0.243 | 2.908 ± 0.188 |
2.863 ± 0.242 | 10.857 ± 0.469 |
Met |
Asn |
Gln |
Pro |
Arg |
Ser |
Thr |
Val |
Trp |
Tyr |
|---|---|---|---|---|---|---|---|---|---|
2.099 ± 0.204 | 3.779 ± 0.416 |
7.585 ± 0.432 | 4.482 ± 0.255 |
8.038 ± 0.686 | 6.598 ± 0.457 |
5.406 ± 0.436 | 6.705 ± 0.387 |
1.334 ± 0.11 | 3.495 ± 0.292 |
Most of the basic statistics you can see at this page can be downloaded from this CSV file
See this proteome in:

Proteome-pI is available under Creative Commons Attribution-NoDerivs license, for more details see here
| Reference: Kozlowski LP. Proteome-pI 2.0: Proteome Isoelectric Point Database Update. Nucleic Acids Res. 2021, doi: 10.1093/nar/gkab944 | Contact: Lukasz P. Kozlowski |