Amnimonas aquatica
Taxonomy: cellular organisms; Bacteria; Proteobacteria; Gammaproteobacteria; Pseudomonadales; Moraxellaceae; Amnimonas
Average proteome isoelectric point is 6.64
Get precalculated fractions of proteins
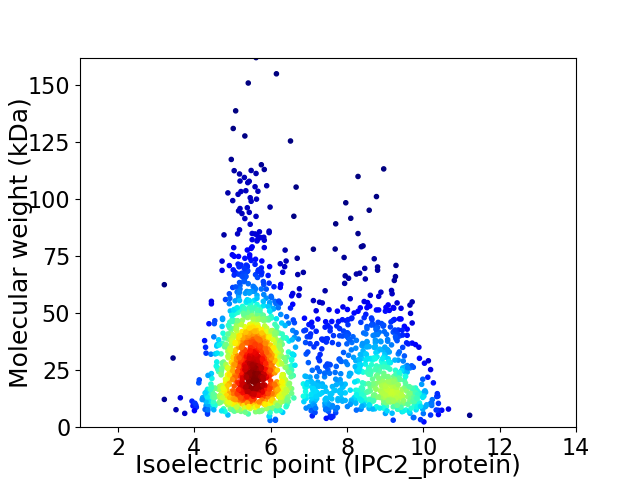
Virtual 2D-PAGE plot for 1914 proteins (isoelectric point calculated using IPC2_protein)
Get csv file with sequences according to given criteria:
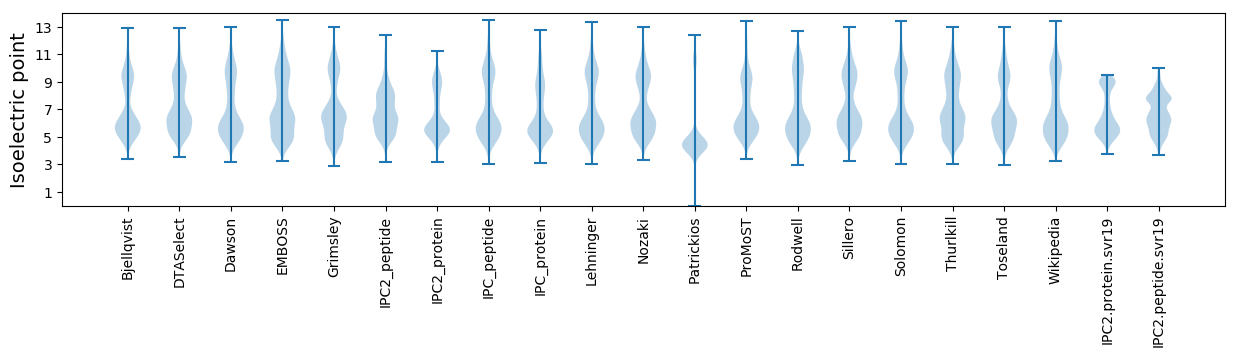
* You can choose from 21 different methods for calculating isoelectric point
Summary statistics related to proteome-wise predictions
Protein with the lowest isoelectric point:
>tr|A0A2P6AUA2|A0A2P6AUA2_9GAMM RNA-binding protein Hfq OS=Amnimonas aquatica OX=2094561 GN=hfq PE=3 SV=1
MM1 pKa = 7.56KK2 pKa = 10.04KK3 pKa = 8.44WQCIVCGFVYY13 pKa = 10.58DD14 pKa = 4.38EE15 pKa = 4.46AVGMPWDD22 pKa = 5.36GIPAGTLWDD31 pKa = 5.95DD32 pKa = 4.27IPADD36 pKa = 4.24WVCPDD41 pKa = 4.0CGVGKK46 pKa = 10.44EE47 pKa = 4.02DD48 pKa = 4.52FEE50 pKa = 4.47MVEE53 pKa = 4.0II54 pKa = 4.86
MM1 pKa = 7.56KK2 pKa = 10.04KK3 pKa = 8.44WQCIVCGFVYY13 pKa = 10.58DD14 pKa = 4.38EE15 pKa = 4.46AVGMPWDD22 pKa = 5.36GIPAGTLWDD31 pKa = 5.95DD32 pKa = 4.27IPADD36 pKa = 4.24WVCPDD41 pKa = 4.0CGVGKK46 pKa = 10.44EE47 pKa = 4.02DD48 pKa = 4.52FEE50 pKa = 4.47MVEE53 pKa = 4.0II54 pKa = 4.86
Molecular weight: 6.07 kDa
Isoelectric point according different methods:
Protein with the highest isoelectric point:
>tr|A0A2P6AQN3|A0A2P6AQN3_9GAMM Dephospho-CoA kinase OS=Amnimonas aquatica OX=2094561 GN=coaE PE=3 SV=1
MM1 pKa = 7.45KK2 pKa = 9.56RR3 pKa = 11.84TFQPSTIKK11 pKa = 10.33QKK13 pKa = 9.06RR14 pKa = 11.84THH16 pKa = 6.13GFRR19 pKa = 11.84ARR21 pKa = 11.84MATKK25 pKa = 10.4NGRR28 pKa = 11.84QVLARR33 pKa = 11.84RR34 pKa = 11.84RR35 pKa = 11.84AKK37 pKa = 9.73GRR39 pKa = 11.84KK40 pKa = 8.88RR41 pKa = 11.84LTVV44 pKa = 3.11
MM1 pKa = 7.45KK2 pKa = 9.56RR3 pKa = 11.84TFQPSTIKK11 pKa = 10.33QKK13 pKa = 9.06RR14 pKa = 11.84THH16 pKa = 6.13GFRR19 pKa = 11.84ARR21 pKa = 11.84MATKK25 pKa = 10.4NGRR28 pKa = 11.84QVLARR33 pKa = 11.84RR34 pKa = 11.84RR35 pKa = 11.84AKK37 pKa = 9.73GRR39 pKa = 11.84KK40 pKa = 8.88RR41 pKa = 11.84LTVV44 pKa = 3.11
Molecular weight: 5.22 kDa
Isoelectric point according different methods:
Peptides (in silico digests for buttom-up proteomics)
Below you can find in silico digests of the whole proteome with Trypsin, Chymotrypsin, Trypsin+LysC, LysN, ArgC proteases suitable for different mass spec machines.| Try ESI |
 |
|---|
| ChTry ESI |
|
|---|
| ArgC ESI |
|
|---|
| LysN ESI |
|
|---|
| TryLysC ESI |
|
|---|
| Try MALDI |
|
|---|
| ChTry MALDI |
|
|---|
| ArgC MALDI |
|
|---|
| LysN MALDI |
|
|---|
| TryLysC MALDI |
|
|---|
| Try LTQ |
|
|---|
| ChTry LTQ |
|
|---|
| ArgC LTQ |
|
|---|
| LysN LTQ |
|
|---|
| TryLysC LTQ |
|
|---|
| Try MSlow |
|
|---|
| ChTry MSlow |
|
|---|
| ArgC MSlow |
|
|---|
| LysN MSlow |
|
|---|
| TryLysC MSlow |
|
|---|
| Try MShigh |
|
|---|
| ChTry MShigh |
|
|---|
| ArgC MShigh |
|
|---|
| LysN MShigh |
|
|---|
| TryLysC MShigh |
|
|---|
General Statistics
Number of major isoforms |
Number of additional isoforms |
Number of all proteins |
Number of amino acids |
Min. Seq. Length |
Max. Seq. Length |
Avg. Seq. Length |
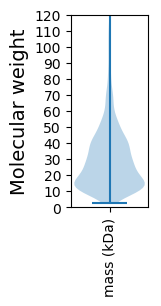
Avg. Mol. Weight |
|---|---|---|---|---|---|---|---|
0 |
537966 |
23 |
1488 |
281.1 |
30.64 |
Amino acid frequency
Ala |
Cys |
Asp |
Glu |
Phe |
Gly |
His |
Ile |
Lys |
Leu |
|---|---|---|---|---|---|---|---|---|---|
12.249 ± 0.078 | 0.909 ± 0.019 |
5.682 ± 0.045 | 5.636 ± 0.048 |
3.386 ± 0.035 | 8.442 ± 0.044 |
2.313 ± 0.027 | 4.563 ± 0.046 |
3.001 ± 0.053 | 11.4 ± 0.081 |
Met |
Asn |
Gln |
Pro |
Arg |
Ser |
Thr |
Val |
Trp |
Tyr |
|---|---|---|---|---|---|---|---|---|---|
2.373 ± 0.024 | 2.438 ± 0.029 |
5.122 ± 0.045 | 3.996 ± 0.037 |
7.483 ± 0.056 | 5.105 ± 0.04 |
4.762 ± 0.033 | 7.524 ± 0.041 |
1.385 ± 0.025 | 2.225 ± 0.026 |
Most of the basic statistics you can see at this page can be downloaded from this CSV file
See this proteome in:

Proteome-pI is available under Creative Commons Attribution-NoDerivs license, for more details see here
| Reference: Kozlowski LP. Proteome-pI 2.0: Proteome Isoelectric Point Database Update. Nucleic Acids Res. 2021, doi: 10.1093/nar/gkab944 | Contact: Lukasz P. Kozlowski |