Novosphingobium sp. AAP93
Taxonomy: cellular organisms; Bacteria; Proteobacteria; Alphaproteobacteria; Sphingomonadales; Sphingomonadaceae; Novosphingobium; unclassified Novosphingobium
Average proteome isoelectric point is 6.46
Get precalculated fractions of proteins
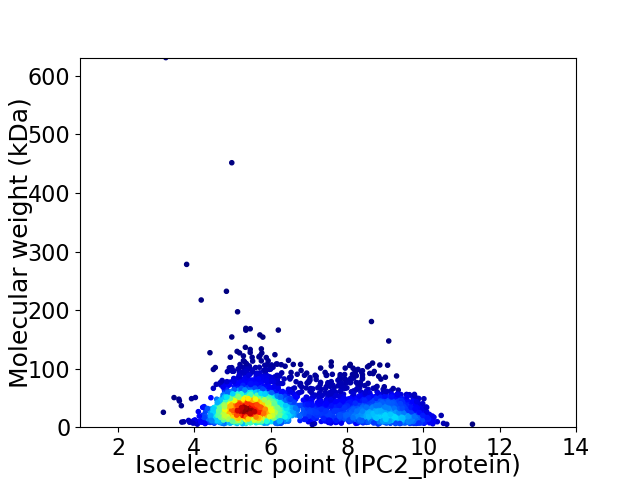
Virtual 2D-PAGE plot for 3654 proteins (isoelectric point calculated using IPC2_protein)
Get csv file with sequences according to given criteria:
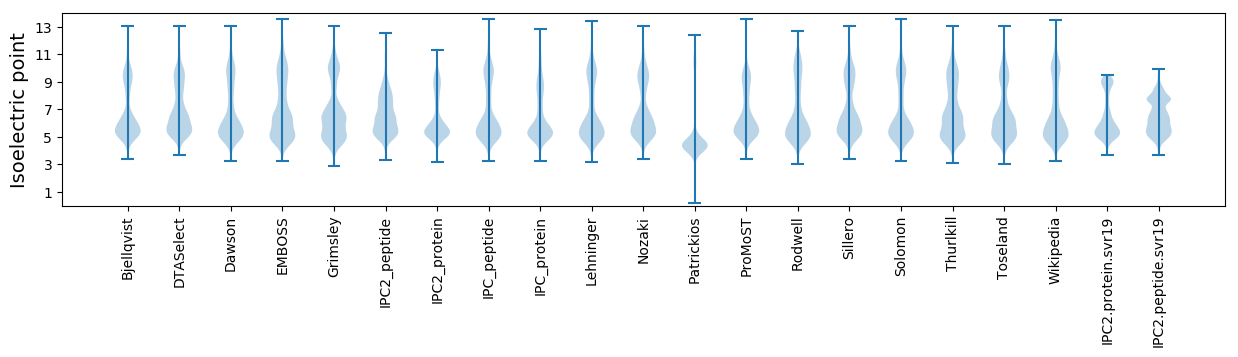
* You can choose from 21 different methods for calculating isoelectric point
Summary statistics related to proteome-wise predictions
Protein with the lowest isoelectric point:
>tr|A0A0N0K7A1|A0A0N0K7A1_9SPHN Peptidase M16 OS=Novosphingobium sp. AAP93 OX=1523427 GN=IP83_10975 PE=3 SV=1
MM1 pKa = 7.64ANLSTTLTFDD11 pKa = 3.9SFDD14 pKa = 3.67LAEE17 pKa = 4.75GGEE20 pKa = 4.19SRR22 pKa = 11.84LANGYY27 pKa = 10.62GGFNWQQAGIYY38 pKa = 8.99NPNGAIAGYY47 pKa = 9.44VASSGQNILFIAEE60 pKa = 3.9AANNEE65 pKa = 4.05VAGYY69 pKa = 9.52EE70 pKa = 3.97DD71 pKa = 3.96AAAGSALVMSRR82 pKa = 11.84EE83 pKa = 4.22APFTLDD89 pKa = 3.93TIQLSSAFRR98 pKa = 11.84DD99 pKa = 3.62GLTVTIRR106 pKa = 11.84AYY108 pKa = 10.61ADD110 pKa = 3.13QAGTILIGEE119 pKa = 4.44KK120 pKa = 9.71TVTVDD125 pKa = 3.23TAAQSLVSFADD136 pKa = 3.71DD137 pKa = 3.68GLDD140 pKa = 3.16YY141 pKa = 9.88GTFSGATRR149 pKa = 11.84IEE151 pKa = 4.37FNANDD156 pKa = 3.76NNAGTNDD163 pKa = 3.43YY164 pKa = 11.08FGIDD168 pKa = 3.19NLTYY172 pKa = 10.51HH173 pKa = 6.72DD174 pKa = 4.45TPPTFTLDD182 pKa = 3.32FDD184 pKa = 6.18DD185 pKa = 4.49IALAPGAEE193 pKa = 4.31TALGTYY199 pKa = 9.8QGFTFAEE206 pKa = 4.21AGAYY210 pKa = 9.44HH211 pKa = 6.76VDD213 pKa = 3.54GSLPGYY219 pKa = 7.74TAASGTNIGFIAEE232 pKa = 4.17ANNNEE237 pKa = 4.06VVGYY241 pKa = 9.01EE242 pKa = 4.15GQAAGSPVVITNPDD256 pKa = 3.03AFDD259 pKa = 3.76FLGGAFSAAFRR270 pKa = 11.84DD271 pKa = 4.6GVAVTIRR278 pKa = 11.84GYY280 pKa = 11.21SDD282 pKa = 4.43ADD284 pKa = 3.5GFNLVAEE291 pKa = 4.31EE292 pKa = 4.51TIVVRR297 pKa = 11.84AGSAQPFSFEE307 pKa = 4.34TFDD310 pKa = 3.45GLHH313 pKa = 6.14RR314 pKa = 11.84LEE316 pKa = 5.27FSTNDD321 pKa = 3.3GDD323 pKa = 4.95PNTNDD328 pKa = 3.11YY329 pKa = 11.69VGFDD333 pKa = 3.39NLLFRR338 pKa = 11.84AADD341 pKa = 3.42VAAQGEE347 pKa = 4.91GILII351 pKa = 4.17
MM1 pKa = 7.64ANLSTTLTFDD11 pKa = 3.9SFDD14 pKa = 3.67LAEE17 pKa = 4.75GGEE20 pKa = 4.19SRR22 pKa = 11.84LANGYY27 pKa = 10.62GGFNWQQAGIYY38 pKa = 8.99NPNGAIAGYY47 pKa = 9.44VASSGQNILFIAEE60 pKa = 3.9AANNEE65 pKa = 4.05VAGYY69 pKa = 9.52EE70 pKa = 3.97DD71 pKa = 3.96AAAGSALVMSRR82 pKa = 11.84EE83 pKa = 4.22APFTLDD89 pKa = 3.93TIQLSSAFRR98 pKa = 11.84DD99 pKa = 3.62GLTVTIRR106 pKa = 11.84AYY108 pKa = 10.61ADD110 pKa = 3.13QAGTILIGEE119 pKa = 4.44KK120 pKa = 9.71TVTVDD125 pKa = 3.23TAAQSLVSFADD136 pKa = 3.71DD137 pKa = 3.68GLDD140 pKa = 3.16YY141 pKa = 9.88GTFSGATRR149 pKa = 11.84IEE151 pKa = 4.37FNANDD156 pKa = 3.76NNAGTNDD163 pKa = 3.43YY164 pKa = 11.08FGIDD168 pKa = 3.19NLTYY172 pKa = 10.51HH173 pKa = 6.72DD174 pKa = 4.45TPPTFTLDD182 pKa = 3.32FDD184 pKa = 6.18DD185 pKa = 4.49IALAPGAEE193 pKa = 4.31TALGTYY199 pKa = 9.8QGFTFAEE206 pKa = 4.21AGAYY210 pKa = 9.44HH211 pKa = 6.76VDD213 pKa = 3.54GSLPGYY219 pKa = 7.74TAASGTNIGFIAEE232 pKa = 4.17ANNNEE237 pKa = 4.06VVGYY241 pKa = 9.01EE242 pKa = 4.15GQAAGSPVVITNPDD256 pKa = 3.03AFDD259 pKa = 3.76FLGGAFSAAFRR270 pKa = 11.84DD271 pKa = 4.6GVAVTIRR278 pKa = 11.84GYY280 pKa = 11.21SDD282 pKa = 4.43ADD284 pKa = 3.5GFNLVAEE291 pKa = 4.31EE292 pKa = 4.51TIVVRR297 pKa = 11.84AGSAQPFSFEE307 pKa = 4.34TFDD310 pKa = 3.45GLHH313 pKa = 6.14RR314 pKa = 11.84LEE316 pKa = 5.27FSTNDD321 pKa = 3.3GDD323 pKa = 4.95PNTNDD328 pKa = 3.11YY329 pKa = 11.69VGFDD333 pKa = 3.39NLLFRR338 pKa = 11.84AADD341 pKa = 3.42VAAQGEE347 pKa = 4.91GILII351 pKa = 4.17
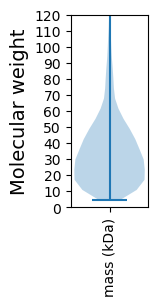
Molecular weight: 36.68 kDa
Isoelectric point according different methods:
Protein with the highest isoelectric point:
>tr|A0A0N1BNJ1|A0A0N1BNJ1_9SPHN Uncharacterized protein OS=Novosphingobium sp. AAP93 OX=1523427 GN=IP83_16315 PE=4 SV=1
MM1 pKa = 7.45KK2 pKa = 9.61RR3 pKa = 11.84TFQPSNLVRR12 pKa = 11.84ARR14 pKa = 11.84RR15 pKa = 11.84HH16 pKa = 4.37GFRR19 pKa = 11.84ARR21 pKa = 11.84MATVGGRR28 pKa = 11.84KK29 pKa = 8.11VLRR32 pKa = 11.84ARR34 pKa = 11.84RR35 pKa = 11.84ARR37 pKa = 11.84GRR39 pKa = 11.84KK40 pKa = 9.02KK41 pKa = 10.61LSAA44 pKa = 4.03
MM1 pKa = 7.45KK2 pKa = 9.61RR3 pKa = 11.84TFQPSNLVRR12 pKa = 11.84ARR14 pKa = 11.84RR15 pKa = 11.84HH16 pKa = 4.37GFRR19 pKa = 11.84ARR21 pKa = 11.84MATVGGRR28 pKa = 11.84KK29 pKa = 8.11VLRR32 pKa = 11.84ARR34 pKa = 11.84RR35 pKa = 11.84ARR37 pKa = 11.84GRR39 pKa = 11.84KK40 pKa = 9.02KK41 pKa = 10.61LSAA44 pKa = 4.03
Molecular weight: 5.11 kDa
Isoelectric point according different methods:
Peptides (in silico digests for buttom-up proteomics)
Below you can find in silico digests of the whole proteome with Trypsin, Chymotrypsin, Trypsin+LysC, LysN, ArgC proteases suitable for different mass spec machines.| Try ESI |
 |
|---|
| ChTry ESI |
|
|---|
| ArgC ESI |
|
|---|
| LysN ESI |
|
|---|
| TryLysC ESI |
|
|---|
| Try MALDI |
|
|---|
| ChTry MALDI |
|
|---|
| ArgC MALDI |
|
|---|
| LysN MALDI |
|
|---|
| TryLysC MALDI |
|
|---|
| Try LTQ |
|
|---|
| ChTry LTQ |
|
|---|
| ArgC LTQ |
|
|---|
| LysN LTQ |
|
|---|
| TryLysC LTQ |
|
|---|
| Try MSlow |
|
|---|
| ChTry MSlow |
|
|---|
| ArgC MSlow |
|
|---|
| LysN MSlow |
|
|---|
| TryLysC MSlow |
|
|---|
| Try MShigh |
|
|---|
| ChTry MShigh |
|
|---|
| ArgC MShigh |
|
|---|
| LysN MShigh |
|
|---|
| TryLysC MShigh |
|
|---|
General Statistics
Number of major isoforms |
Number of additional isoforms |
Number of all proteins |
Number of amino acids |
Min. Seq. Length |
Max. Seq. Length |
Avg. Seq. Length |
Avg. Mol. Weight |
|---|---|---|---|---|---|---|---|
0 |
1213131 |
41 |
6642 |
332.0 |
35.73 |
Amino acid frequency
Ala |
Cys |
Asp |
Glu |
Phe |
Gly |
His |
Ile |
Lys |
Leu |
|---|---|---|---|---|---|---|---|---|---|
13.772 ± 0.067 | 0.825 ± 0.012 |
5.67 ± 0.052 | 5.435 ± 0.036 |
3.556 ± 0.025 | 9.132 ± 0.089 |
2.044 ± 0.024 | 4.779 ± 0.023 |
3.04 ± 0.03 | 9.924 ± 0.048 |
Met |
Asn |
Gln |
Pro |
Arg |
Ser |
Thr |
Val |
Trp |
Tyr |
|---|---|---|---|---|---|---|---|---|---|
2.449 ± 0.026 | 2.522 ± 0.034 |
5.47 ± 0.043 | 3.046 ± 0.023 |
6.956 ± 0.047 | 5.023 ± 0.039 |
5.36 ± 0.041 | 7.252 ± 0.029 |
1.486 ± 0.018 | 2.258 ± 0.023 |
Most of the basic statistics you can see at this page can be downloaded from this CSV file
See this proteome in:

Proteome-pI is available under Creative Commons Attribution-NoDerivs license, for more details see here
| Reference: Kozlowski LP. Proteome-pI 2.0: Proteome Isoelectric Point Database Update. Nucleic Acids Res. 2021, doi: 10.1093/nar/gkab944 | Contact: Lukasz P. Kozlowski |