Yersinia phage phiR8-01
Taxonomy: Viruses; Duplodnaviria; Heunggongvirae; Uroviricota; Caudoviricetes; Caudovirales; Autographiviridae; Melnykvirinae; Pienvirus; Yersinia virus R8-01
Average proteome isoelectric point is 6.65
Get precalculated fractions of proteins
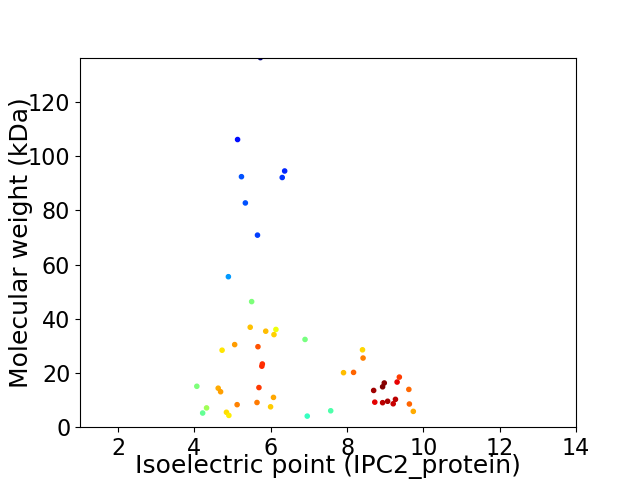
Virtual 2D-PAGE plot for 50 proteins (isoelectric point calculated using IPC2_protein)
Get csv file with sequences according to given criteria:
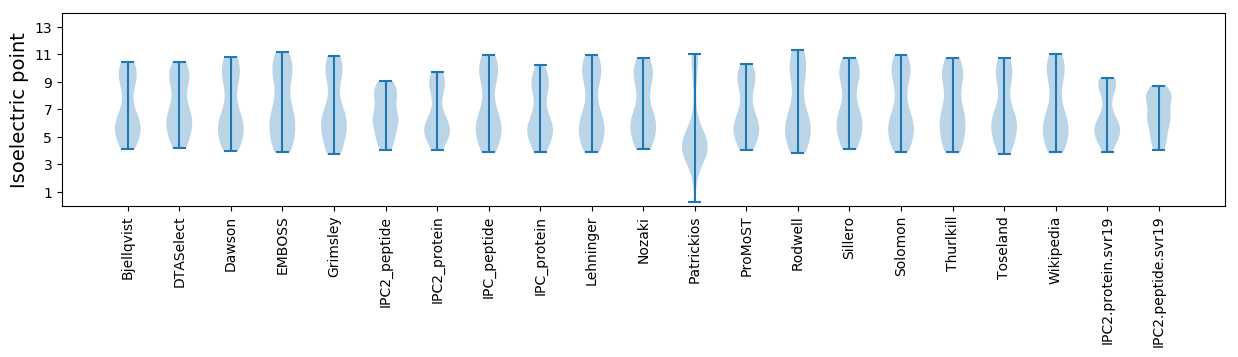
* You can choose from 21 different methods for calculating isoelectric point
Summary statistics related to proteome-wise predictions
Protein with the lowest isoelectric point:
>tr|I7K2I4|I7K2I4_9CAUD Uncharacterized protein OS=Yersinia phage phiR8-01 OX=1206556 GN=g025 PE=4 SV=2
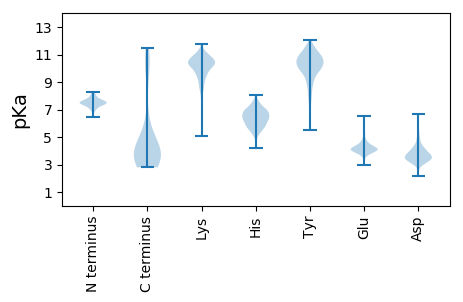
MM1 pKa = 7.45RR2 pKa = 11.84HH3 pKa = 5.9ALINTVNVEE12 pKa = 4.27DD13 pKa = 4.29LCNAVPCGTMDD24 pKa = 3.75CWQCPLEE31 pKa = 4.21STQALNEE38 pKa = 4.03FLRR41 pKa = 11.84EE42 pKa = 4.14NTDD45 pKa = 3.24EE46 pKa = 4.06
MM1 pKa = 7.45RR2 pKa = 11.84HH3 pKa = 5.9ALINTVNVEE12 pKa = 4.27DD13 pKa = 4.29LCNAVPCGTMDD24 pKa = 3.75CWQCPLEE31 pKa = 4.21STQALNEE38 pKa = 4.03FLRR41 pKa = 11.84EE42 pKa = 4.14NTDD45 pKa = 3.24EE46 pKa = 4.06
Molecular weight: 5.23 kDa
Isoelectric point according different methods:
Protein with the highest isoelectric point:
>tr|I7K2H8|I7K2H8_9CAUD Uncharacterized protein OS=Yersinia phage phiR8-01 OX=1206556 GN=g015 PE=4 SV=2
MM1 pKa = 7.64SEE3 pKa = 3.86YY4 pKa = 11.05NKK6 pKa = 10.55AINARR11 pKa = 11.84KK12 pKa = 9.07EE13 pKa = 3.68RR14 pKa = 11.84QKK16 pKa = 10.89AIKK19 pKa = 9.75RR20 pKa = 11.84ARR22 pKa = 11.84KK23 pKa = 8.11EE24 pKa = 4.05KK25 pKa = 10.5EE26 pKa = 3.53GMRR29 pKa = 11.84YY30 pKa = 5.51TTEE33 pKa = 3.87GDD35 pKa = 3.69FTHH38 pKa = 7.27LASNTMKK45 pKa = 10.24FRR47 pKa = 11.84RR48 pKa = 11.84GG49 pKa = 3.12
MM1 pKa = 7.64SEE3 pKa = 3.86YY4 pKa = 11.05NKK6 pKa = 10.55AINARR11 pKa = 11.84KK12 pKa = 9.07EE13 pKa = 3.68RR14 pKa = 11.84QKK16 pKa = 10.89AIKK19 pKa = 9.75RR20 pKa = 11.84ARR22 pKa = 11.84KK23 pKa = 8.11EE24 pKa = 4.05KK25 pKa = 10.5EE26 pKa = 3.53GMRR29 pKa = 11.84YY30 pKa = 5.51TTEE33 pKa = 3.87GDD35 pKa = 3.69FTHH38 pKa = 7.27LASNTMKK45 pKa = 10.24FRR47 pKa = 11.84RR48 pKa = 11.84GG49 pKa = 3.12
Molecular weight: 5.84 kDa
Isoelectric point according different methods:
Peptides (in silico digests for buttom-up proteomics)
Below you can find in silico digests of the whole proteome with Trypsin, Chymotrypsin, Trypsin+LysC, LysN, ArgC proteases suitable for different mass spec machines.| Try ESI |
 |
|---|
| ChTry ESI |
|
|---|
| ArgC ESI |
|
|---|
| LysN ESI |
|
|---|
| TryLysC ESI |
|
|---|
| Try MALDI |
|
|---|
| ChTry MALDI |
|
|---|
| ArgC MALDI |
|
|---|
| LysN MALDI |
|
|---|
| TryLysC MALDI |
|
|---|
| Try LTQ |
|
|---|
| ChTry LTQ |
|
|---|
| ArgC LTQ |
|
|---|
| LysN LTQ |
|
|---|
| TryLysC LTQ |
|
|---|
| Try MSlow |
|
|---|
| ChTry MSlow |
|
|---|
| ArgC MSlow |
|
|---|
| LysN MSlow |
|
|---|
| TryLysC MSlow |
|
|---|
| Try MShigh |
|
|---|
| ChTry MShigh |
|
|---|
| ArgC MShigh |
|
|---|
| LysN MShigh |
|
|---|
| TryLysC MShigh |
|
|---|
General Statistics
Number of major isoforms |
Number of additional isoforms |
Number of all proteins |
Number of amino acids |
Min. Seq. Length |
Max. Seq. Length |
Avg. Seq. Length |
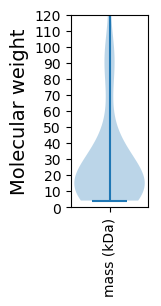
Avg. Mol. Weight |
|---|---|---|---|---|---|---|---|
0 |
13104 |
36 |
1253 |
262.1 |
29.22 |
Amino acid frequency
Ala |
Cys |
Asp |
Glu |
Phe |
Gly |
His |
Ile |
Lys |
Leu |
|---|---|---|---|---|---|---|---|---|---|
9.501 ± 0.501 | 1.007 ± 0.163 |
6.334 ± 0.228 | 6.227 ± 0.323 |
3.671 ± 0.219 | 7.578 ± 0.338 |
1.908 ± 0.138 | 4.51 ± 0.215 |
6.143 ± 0.246 | 8.15 ± 0.331 |
Met |
Asn |
Gln |
Pro |
Arg |
Ser |
Thr |
Val |
Trp |
Tyr |
|---|---|---|---|---|---|---|---|---|---|
3.365 ± 0.171 | 4.464 ± 0.228 |
4.075 ± 0.228 | 4.327 ± 0.328 |
5.693 ± 0.269 | 5.624 ± 0.339 |
5.678 ± 0.249 | 6.7 ± 0.302 |
1.633 ± 0.22 | 3.404 ± 0.191 |
Most of the basic statistics you can see at this page can be downloaded from this CSV file
See this proteome in:

Proteome-pI is available under Creative Commons Attribution-NoDerivs license, for more details see here
| Reference: Kozlowski LP. Proteome-pI 2.0: Proteome Isoelectric Point Database Update. Nucleic Acids Res. 2021, doi: 10.1093/nar/gkab944 | Contact: Lukasz P. Kozlowski |