Diodia vein chlorosis virus
Taxonomy: Viruses; Riboviria; Orthornavirae; Kitrinoviricota; Alsuviricetes; Martellivirales; Closteroviridae; Crinivirus
Average proteome isoelectric point is 6.62
Get precalculated fractions of proteins
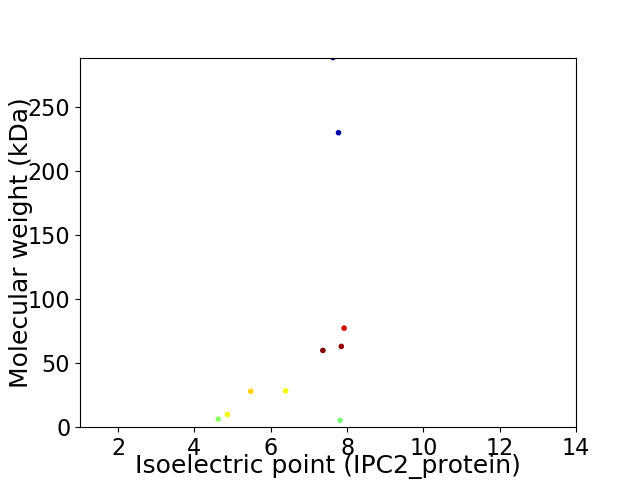
Virtual 2D-PAGE plot for 10 proteins (isoelectric point calculated using IPC2_protein)
Get csv file with sequences according to given criteria:
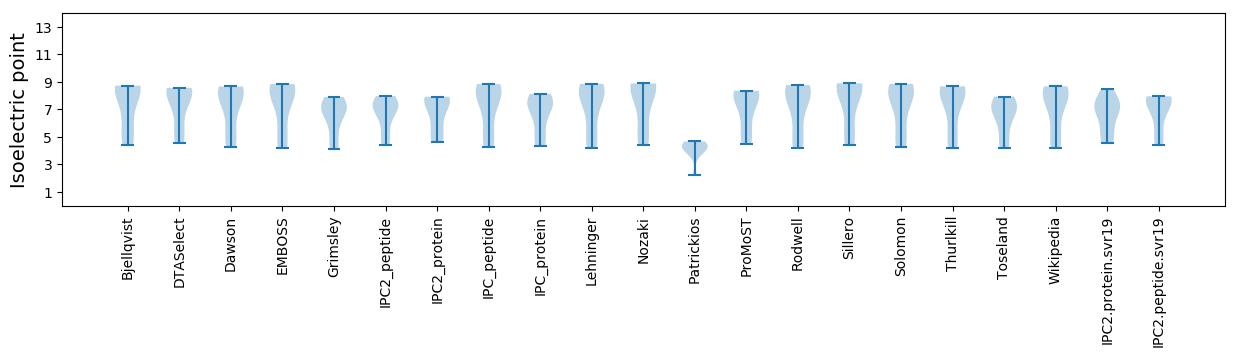
* You can choose from 21 different methods for calculating isoelectric point
Summary statistics related to proteome-wise predictions
Protein with the lowest isoelectric point:
>tr|E7BKK0|E7BKK0_9CLOS p60 OS=Diodia vein chlorosis virus OX=656520 PE=4 SV=1
MM1 pKa = 7.41ALVVLLLLEE10 pKa = 4.16MFGGFNSYY18 pKa = 10.55YY19 pKa = 10.76LSDD22 pKa = 3.5NSSFSGQILVIRR34 pKa = 11.84TEE36 pKa = 4.08DD37 pKa = 3.52PKK39 pKa = 11.5LLTDD43 pKa = 4.32ILLEE47 pKa = 3.86LPYY50 pKa = 10.37IKK52 pKa = 10.35EE53 pKa = 3.8RR54 pKa = 11.84WW55 pKa = 3.38
MM1 pKa = 7.41ALVVLLLLEE10 pKa = 4.16MFGGFNSYY18 pKa = 10.55YY19 pKa = 10.76LSDD22 pKa = 3.5NSSFSGQILVIRR34 pKa = 11.84TEE36 pKa = 4.08DD37 pKa = 3.52PKK39 pKa = 11.5LLTDD43 pKa = 4.32ILLEE47 pKa = 3.86LPYY50 pKa = 10.37IKK52 pKa = 10.35EE53 pKa = 3.8RR54 pKa = 11.84WW55 pKa = 3.38
Molecular weight: 6.37 kDa
Isoelectric point according different methods:
Protein with the highest isoelectric point:
>tr|E7BKJ9|E7BKJ9_9CLOS p6 OS=Diodia vein chlorosis virus OX=656520 PE=4 SV=1
MM1 pKa = 6.94NTDD4 pKa = 3.27ILISCLEE11 pKa = 3.94KK12 pKa = 11.04FNINKK17 pKa = 9.12NFSFEE22 pKa = 4.39NYY24 pKa = 9.17GSQGRR29 pKa = 11.84FRR31 pKa = 11.84FWYY34 pKa = 9.76NIQYY38 pKa = 9.87YY39 pKa = 10.75LKK41 pKa = 10.63LCC43 pKa = 4.27
MM1 pKa = 6.94NTDD4 pKa = 3.27ILISCLEE11 pKa = 3.94KK12 pKa = 11.04FNINKK17 pKa = 9.12NFSFEE22 pKa = 4.39NYY24 pKa = 9.17GSQGRR29 pKa = 11.84FRR31 pKa = 11.84FWYY34 pKa = 9.76NIQYY38 pKa = 9.87YY39 pKa = 10.75LKK41 pKa = 10.63LCC43 pKa = 4.27
Molecular weight: 5.32 kDa
Isoelectric point according different methods:
Peptides (in silico digests for buttom-up proteomics)
Below you can find in silico digests of the whole proteome with Trypsin, Chymotrypsin, Trypsin+LysC, LysN, ArgC proteases suitable for different mass spec machines.| Try ESI |
 |
|---|
| ChTry ESI |
|
|---|
| ArgC ESI |
|
|---|
| LysN ESI |
|
|---|
| TryLysC ESI |
|
|---|
| Try MALDI |
|
|---|
| ChTry MALDI |
|
|---|
| ArgC MALDI |
|
|---|
| LysN MALDI |
|
|---|
| TryLysC MALDI |
|
|---|
| Try LTQ |
|
|---|
| ChTry LTQ |
|
|---|
| ArgC LTQ |
|
|---|
| LysN LTQ |
|
|---|
| TryLysC LTQ |
|
|---|
| Try MSlow |
|
|---|
| ChTry MSlow |
|
|---|
| ArgC MSlow |
|
|---|
| LysN MSlow |
|
|---|
| TryLysC MSlow |
|
|---|
| Try MShigh |
|
|---|
| ChTry MShigh |
|
|---|
| ArgC MShigh |
|
|---|
| LysN MShigh |
|
|---|
| TryLysC MShigh |
|
|---|
General Statistics
Number of major isoforms |
Number of additional isoforms |
Number of all proteins |
Number of amino acids |
Min. Seq. Length |
Max. Seq. Length |
Avg. Seq. Length |
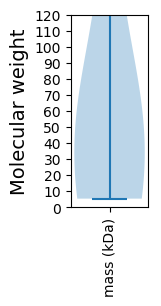
Avg. Mol. Weight |
|---|---|---|---|---|---|---|---|
0 |
6925 |
43 |
2505 |
692.5 |
79.59 |
Amino acid frequency
Ala |
Cys |
Asp |
Glu |
Phe |
Gly |
His |
Ile |
Lys |
Leu |
|---|---|---|---|---|---|---|---|---|---|
3.812 ± 0.272 | 2.094 ± 0.242 |
6.801 ± 0.196 | 5.805 ± 0.313 |
5.762 ± 0.248 | 4.765 ± 0.237 |
1.314 ± 0.135 | 7.032 ± 0.249 |
8.953 ± 0.296 | 8.982 ± 0.198 |
Met |
Asn |
Gln |
Pro |
Arg |
Ser |
Thr |
Val |
Trp |
Tyr |
|---|---|---|---|---|---|---|---|---|---|
2.599 ± 0.213 | 6.469 ± 0.504 |
3.018 ± 0.201 | 2.671 ± 0.142 |
4.635 ± 0.138 | 7.841 ± 0.344 |
4.996 ± 0.297 | 7.206 ± 0.242 |
0.664 ± 0.066 | 4.578 ± 0.182 |
Most of the basic statistics you can see at this page can be downloaded from this CSV file
See this proteome in:

Proteome-pI is available under Creative Commons Attribution-NoDerivs license, for more details see here
| Reference: Kozlowski LP. Proteome-pI 2.0: Proteome Isoelectric Point Database Update. Nucleic Acids Res. 2021, doi: 10.1093/nar/gkab944 | Contact: Lukasz P. Kozlowski |