Prochlorococcus phage P-SSM4
Taxonomy: Viruses; Duplodnaviria; Heunggongvirae; Uroviricota; Caudoviricetes; Caudovirales; Myoviridae; Ronodorvirus; Prochlorococcus virus PSSM4
Average proteome isoelectric point is 5.89
Get precalculated fractions of proteins
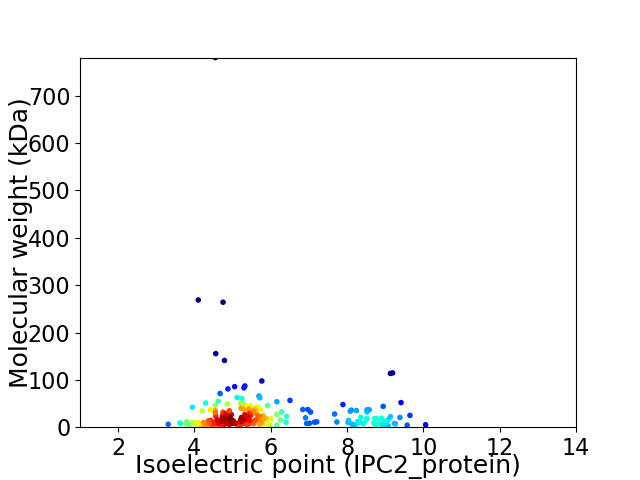
Virtual 2D-PAGE plot for 221 proteins (isoelectric point calculated using IPC2_protein)
Get csv file with sequences according to given criteria:
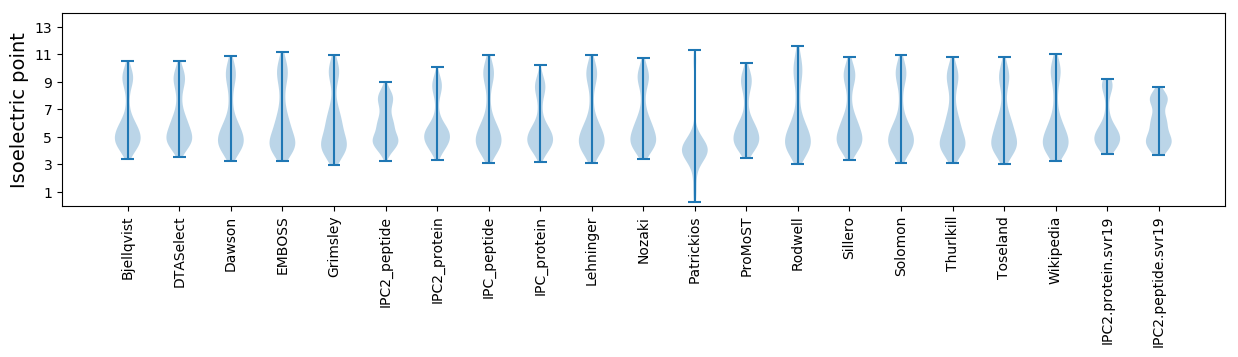
* You can choose from 21 different methods for calculating isoelectric point
Summary statistics related to proteome-wise predictions
Protein with the lowest isoelectric point:
>tr|Q58LP4|Q58LP4_BPPRS Uncharacterized protein OS=Prochlorococcus phage P-SSM4 OX=268747 GN=PSSM4_054 PE=4 SV=1
MM1 pKa = 7.45TFLNDD6 pKa = 2.53IHH8 pKa = 7.64DD9 pKa = 3.94IVEE12 pKa = 4.25EE13 pKa = 4.37GDD15 pKa = 3.17NGTAHH20 pKa = 7.62DD21 pKa = 5.26IIDD24 pKa = 3.67VMFNLLDD31 pKa = 4.14EE32 pKa = 4.69NQLTQLQDD40 pKa = 3.53VIANQYY46 pKa = 9.18PYY48 pKa = 10.03PDD50 pKa = 4.63KK51 pKa = 11.2DD52 pKa = 4.58DD53 pKa = 4.65LFIDD57 pKa = 3.86INNTGGKK64 pKa = 9.13YY65 pKa = 9.97
MM1 pKa = 7.45TFLNDD6 pKa = 2.53IHH8 pKa = 7.64DD9 pKa = 3.94IVEE12 pKa = 4.25EE13 pKa = 4.37GDD15 pKa = 3.17NGTAHH20 pKa = 7.62DD21 pKa = 5.26IIDD24 pKa = 3.67VMFNLLDD31 pKa = 4.14EE32 pKa = 4.69NQLTQLQDD40 pKa = 3.53VIANQYY46 pKa = 9.18PYY48 pKa = 10.03PDD50 pKa = 4.63KK51 pKa = 11.2DD52 pKa = 4.58DD53 pKa = 4.65LFIDD57 pKa = 3.86INNTGGKK64 pKa = 9.13YY65 pKa = 9.97
Molecular weight: 7.44 kDa
Isoelectric point according different methods:
Protein with the highest isoelectric point:
>tr|Q58LM4|Q58LM4_BPPRS Uncharacterized protein OS=Prochlorococcus phage P-SSM4 OX=268747 GN=PSSM4_074 PE=4 SV=1
MM1 pKa = 7.55AMYY4 pKa = 11.13KK5 pKa = 9.49MGLSEE10 pKa = 5.44IEE12 pKa = 4.36SKK14 pKa = 10.46PKK16 pKa = 9.18KK17 pKa = 8.31TRR19 pKa = 11.84QGNGAHH25 pKa = 6.03TKK27 pKa = 10.24YY28 pKa = 10.79SATARR33 pKa = 11.84NKK35 pKa = 9.71KK36 pKa = 9.11KK37 pKa = 10.44KK38 pKa = 9.43PYY40 pKa = 9.62RR41 pKa = 11.84GQGKK45 pKa = 9.57
MM1 pKa = 7.55AMYY4 pKa = 11.13KK5 pKa = 9.49MGLSEE10 pKa = 5.44IEE12 pKa = 4.36SKK14 pKa = 10.46PKK16 pKa = 9.18KK17 pKa = 8.31TRR19 pKa = 11.84QGNGAHH25 pKa = 6.03TKK27 pKa = 10.24YY28 pKa = 10.79SATARR33 pKa = 11.84NKK35 pKa = 9.71KK36 pKa = 9.11KK37 pKa = 10.44KK38 pKa = 9.43PYY40 pKa = 9.62RR41 pKa = 11.84GQGKK45 pKa = 9.57
Molecular weight: 5.09 kDa
Isoelectric point according different methods:
Peptides (in silico digests for buttom-up proteomics)
Below you can find in silico digests of the whole proteome with Trypsin, Chymotrypsin, Trypsin+LysC, LysN, ArgC proteases suitable for different mass spec machines.| Try ESI |
 |
|---|
| ChTry ESI |
|
|---|
| ArgC ESI |
|
|---|
| LysN ESI |
|
|---|
| TryLysC ESI |
|
|---|
| Try MALDI |
|
|---|
| ChTry MALDI |
|
|---|
| ArgC MALDI |
|
|---|
| LysN MALDI |
|
|---|
| TryLysC MALDI |
|
|---|
| Try LTQ |
|
|---|
| ChTry LTQ |
|
|---|
| ArgC LTQ |
|
|---|
| LysN LTQ |
|
|---|
| TryLysC LTQ |
|
|---|
| Try MSlow |
|
|---|
| ChTry MSlow |
|
|---|
| ArgC MSlow |
|
|---|
| LysN MSlow |
|
|---|
| TryLysC MSlow |
|
|---|
| Try MShigh |
|
|---|
| ChTry MShigh |
|
|---|
| ArgC MShigh |
|
|---|
| LysN MShigh |
|
|---|
| TryLysC MShigh |
|
|---|
General Statistics
Number of major isoforms |
Number of additional isoforms |
Number of all proteins |
Number of amino acids |
Min. Seq. Length |
Max. Seq. Length |
Avg. Seq. Length |
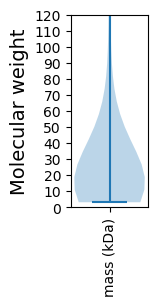
Avg. Mol. Weight |
|---|---|---|---|---|---|---|---|
0 |
56763 |
25 |
7312 |
256.8 |
28.52 |
Amino acid frequency
Ala |
Cys |
Asp |
Glu |
Phe |
Gly |
His |
Ile |
Lys |
Leu |
|---|---|---|---|---|---|---|---|---|---|
7.008 ± 0.282 | 0.787 ± 0.084 |
6.576 ± 0.152 | 5.819 ± 0.372 |
4.304 ± 0.12 | 7.833 ± 0.406 |
1.582 ± 0.116 | 6.58 ± 0.156 |
6.31 ± 0.51 | 6.975 ± 0.199 |
Met |
Asn |
Gln |
Pro |
Arg |
Ser |
Thr |
Val |
Trp |
Tyr |
|---|---|---|---|---|---|---|---|---|---|
2.052 ± 0.215 | 6.037 ± 0.223 |
3.717 ± 0.135 | 3.631 ± 0.094 |
3.922 ± 0.2 | 6.941 ± 0.26 |
7.998 ± 0.626 | 6.451 ± 0.193 |
1.168 ± 0.098 | 4.307 ± 0.147 |
Most of the basic statistics you can see at this page can be downloaded from this CSV file
See this proteome in:

Proteome-pI is available under Creative Commons Attribution-NoDerivs license, for more details see here
| Reference: Kozlowski LP. Proteome-pI 2.0: Proteome Isoelectric Point Database Update. Nucleic Acids Res. 2021, doi: 10.1093/nar/gkab944 | Contact: Lukasz P. Kozlowski |