Staphylococcus virus 42e
Taxonomy: Viruses; Duplodnaviria; Heunggongvirae; Uroviricota; Caudoviricetes; Caudovirales; Siphoviridae; Triavirus
Average proteome isoelectric point is 6.47
Get precalculated fractions of proteins
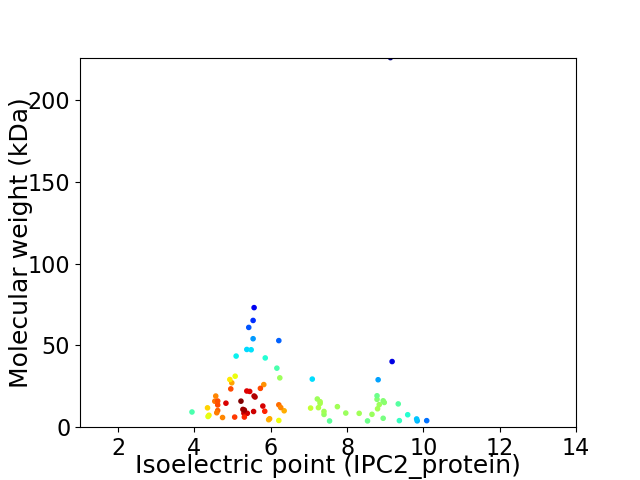
Virtual 2D-PAGE plot for 79 proteins (isoelectric point calculated using IPC2_protein)
Get csv file with sequences according to given criteria:
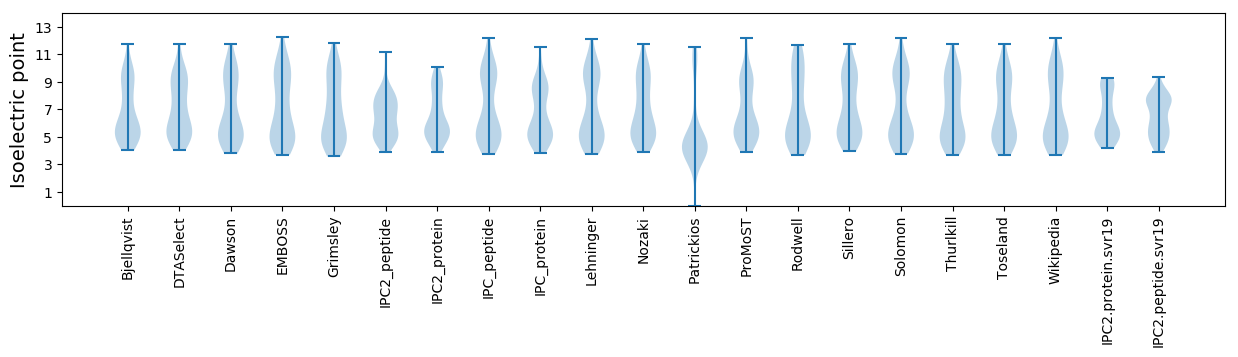
* You can choose from 21 different methods for calculating isoelectric point
Summary statistics related to proteome-wise predictions
Protein with the lowest isoelectric point:
>tr|Q4ZCV9|Q4ZCV9_9CAUD ORF064 OS=Staphylococcus virus 42e OX=320837 PE=4 SV=1
MM1 pKa = 7.17MNNRR5 pKa = 11.84EE6 pKa = 4.11QIEE9 pKa = 3.98QSVISASAYY18 pKa = 10.04NGNDD22 pKa = 3.29TEE24 pKa = 4.52GLLKK28 pKa = 10.49EE29 pKa = 4.44IEE31 pKa = 4.24DD32 pKa = 4.28VYY34 pKa = 11.57KK35 pKa = 10.64KK36 pKa = 10.72AQAFDD41 pKa = 4.66EE42 pKa = 4.34ILEE45 pKa = 4.2GLPNAMQDD53 pKa = 3.61ALKK56 pKa = 10.63EE57 pKa = 4.3DD58 pKa = 3.43IGLDD62 pKa = 3.48EE63 pKa = 5.32AVGIMTGQVVYY74 pKa = 10.25KK75 pKa = 10.48YY76 pKa = 10.54EE77 pKa = 4.02EE78 pKa = 4.2EE79 pKa = 4.27QEE81 pKa = 4.06SDD83 pKa = 3.01
MM1 pKa = 7.17MNNRR5 pKa = 11.84EE6 pKa = 4.11QIEE9 pKa = 3.98QSVISASAYY18 pKa = 10.04NGNDD22 pKa = 3.29TEE24 pKa = 4.52GLLKK28 pKa = 10.49EE29 pKa = 4.44IEE31 pKa = 4.24DD32 pKa = 4.28VYY34 pKa = 11.57KK35 pKa = 10.64KK36 pKa = 10.72AQAFDD41 pKa = 4.66EE42 pKa = 4.34ILEE45 pKa = 4.2GLPNAMQDD53 pKa = 3.61ALKK56 pKa = 10.63EE57 pKa = 4.3DD58 pKa = 3.43IGLDD62 pKa = 3.48EE63 pKa = 5.32AVGIMTGQVVYY74 pKa = 10.25KK75 pKa = 10.48YY76 pKa = 10.54EE77 pKa = 4.02EE78 pKa = 4.2EE79 pKa = 4.27QEE81 pKa = 4.06SDD83 pKa = 3.01
Molecular weight: 9.3 kDa
Isoelectric point according different methods:
Protein with the highest isoelectric point:
>tr|Q4ZCX5|Q4ZCX5_9CAUD ORF098 OS=Staphylococcus virus 42e OX=320837 PE=4 SV=1
MM1 pKa = 7.2NVAILANPAIDD12 pKa = 3.52HH13 pKa = 6.54AVVKK17 pKa = 9.77YY18 pKa = 10.59RR19 pKa = 11.84NGISTIAKK27 pKa = 6.56TVKK30 pKa = 10.25HH31 pKa = 5.3STATRR36 pKa = 3.39
MM1 pKa = 7.2NVAILANPAIDD12 pKa = 3.52HH13 pKa = 6.54AVVKK17 pKa = 9.77YY18 pKa = 10.59RR19 pKa = 11.84NGISTIAKK27 pKa = 6.56TVKK30 pKa = 10.25HH31 pKa = 5.3STATRR36 pKa = 3.39
Molecular weight: 3.86 kDa
Isoelectric point according different methods:
Peptides (in silico digests for buttom-up proteomics)
Below you can find in silico digests of the whole proteome with Trypsin, Chymotrypsin, Trypsin+LysC, LysN, ArgC proteases suitable for different mass spec machines.| Try ESI |
 |
|---|
| ChTry ESI |
|
|---|
| ArgC ESI |
|
|---|
| LysN ESI |
|
|---|
| TryLysC ESI |
|
|---|
| Try MALDI |
|
|---|
| ChTry MALDI |
|
|---|
| ArgC MALDI |
|
|---|
| LysN MALDI |
|
|---|
| TryLysC MALDI |
|
|---|
| Try LTQ |
|
|---|
| ChTry LTQ |
|
|---|
| ArgC LTQ |
|
|---|
| LysN LTQ |
|
|---|
| TryLysC LTQ |
|
|---|
| Try MSlow |
|
|---|
| ChTry MSlow |
|
|---|
| ArgC MSlow |
|
|---|
| LysN MSlow |
|
|---|
| TryLysC MSlow |
|
|---|
| Try MShigh |
|
|---|
| ChTry MShigh |
|
|---|
| ArgC MShigh |
|
|---|
| LysN MShigh |
|
|---|
| TryLysC MShigh |
|
|---|
General Statistics
Number of major isoforms |
Number of additional isoforms |
Number of all proteins |
Number of amino acids |
Min. Seq. Length |
Max. Seq. Length |
Avg. Seq. Length |
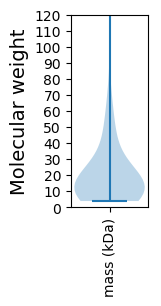
Avg. Mol. Weight |
|---|---|---|---|---|---|---|---|
0 |
14688 |
33 |
2066 |
185.9 |
21.25 |
Amino acid frequency
Ala |
Cys |
Asp |
Glu |
Phe |
Gly |
His |
Ile |
Lys |
Leu |
|---|---|---|---|---|---|---|---|---|---|
5.76 ± 0.524 | 0.517 ± 0.094 |
6.291 ± 0.281 | 7.523 ± 0.326 |
3.894 ± 0.232 | 5.964 ± 0.521 |
1.845 ± 0.148 | 7.19 ± 0.321 |
9.838 ± 0.407 | 8.068 ± 0.275 |
Met |
Asn |
Gln |
Pro |
Arg |
Ser |
Thr |
Val |
Trp |
Tyr |
|---|---|---|---|---|---|---|---|---|---|
2.757 ± 0.152 | 6.59 ± 0.249 |
2.614 ± 0.209 | 3.969 ± 0.157 |
4.01 ± 0.167 | 6.182 ± 0.365 |
5.903 ± 0.239 | 5.678 ± 0.231 |
1.178 ± 0.133 | 4.228 ± 0.311 |
Most of the basic statistics you can see at this page can be downloaded from this CSV file
See this proteome in:

Proteome-pI is available under Creative Commons Attribution-NoDerivs license, for more details see here
| Reference: Kozlowski LP. Proteome-pI 2.0: Proteome Isoelectric Point Database Update. Nucleic Acids Res. 2021, doi: 10.1093/nar/gkab944 | Contact: Lukasz P. Kozlowski |