Staphylococcus virus 71
Taxonomy: Viruses; Duplodnaviria; Heunggongvirae; Uroviricota; Caudoviricetes; Caudovirales; Siphoviridae; Azeredovirinae; Phietavirus
Average proteome isoelectric point is 6.69
Get precalculated fractions of proteins
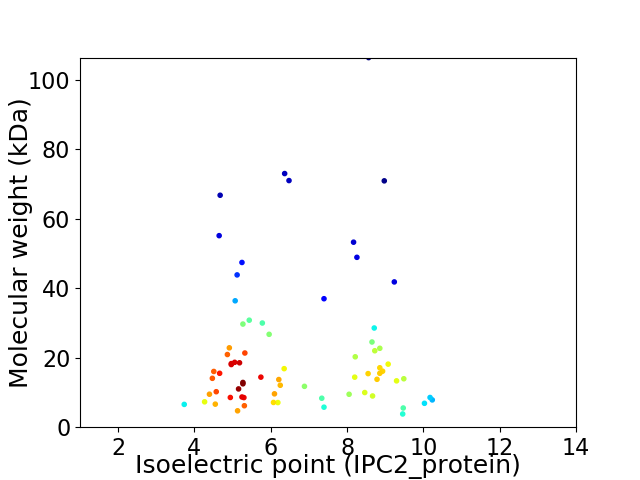
Virtual 2D-PAGE plot for 72 proteins (isoelectric point calculated using IPC2_protein)
Get csv file with sequences according to given criteria:
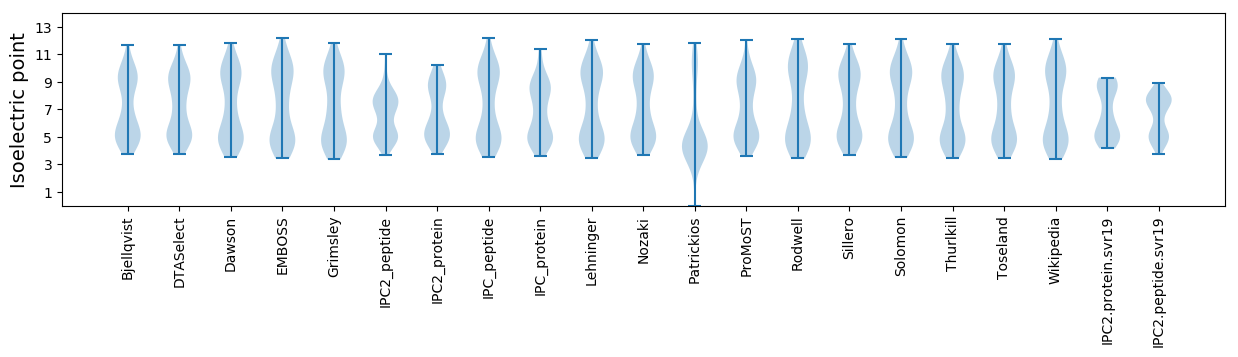
* You can choose from 21 different methods for calculating isoelectric point
Summary statistics related to proteome-wise predictions
Protein with the lowest isoelectric point:
>tr|Q4ZBD2|Q4ZBD2_9CAUD ORF062 OS=Staphylococcus virus 71 OX=320844 PE=4 SV=1
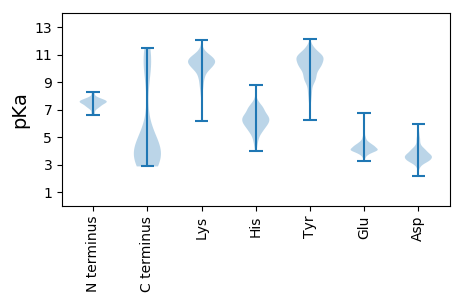
MM1 pKa = 7.59KK2 pKa = 10.23KK3 pKa = 10.48FNVQITYY10 pKa = 9.56TGMIEE15 pKa = 3.91EE16 pKa = 4.54TIEE19 pKa = 4.21AEE21 pKa = 4.2SLEE24 pKa = 4.2EE25 pKa = 4.29AEE27 pKa = 5.02NEE29 pKa = 4.01ARR31 pKa = 11.84DD32 pKa = 3.74IAMMEE37 pKa = 4.13VPFDD41 pKa = 3.87CDD43 pKa = 2.9EE44 pKa = 4.32YY45 pKa = 10.54EE46 pKa = 4.1INVEE50 pKa = 4.13VEE52 pKa = 4.08QEE54 pKa = 3.56NDD56 pKa = 2.86
MM1 pKa = 7.59KK2 pKa = 10.23KK3 pKa = 10.48FNVQITYY10 pKa = 9.56TGMIEE15 pKa = 3.91EE16 pKa = 4.54TIEE19 pKa = 4.21AEE21 pKa = 4.2SLEE24 pKa = 4.2EE25 pKa = 4.29AEE27 pKa = 5.02NEE29 pKa = 4.01ARR31 pKa = 11.84DD32 pKa = 3.74IAMMEE37 pKa = 4.13VPFDD41 pKa = 3.87CDD43 pKa = 2.9EE44 pKa = 4.32YY45 pKa = 10.54EE46 pKa = 4.1INVEE50 pKa = 4.13VEE52 pKa = 4.08QEE54 pKa = 3.56NDD56 pKa = 2.86
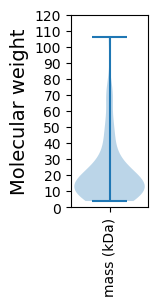
Molecular weight: 6.56 kDa
Isoelectric point according different methods:
Protein with the highest isoelectric point:
>tr|Q4ZBI7|Q4ZBI7_9CAUD ORF046 OS=Staphylococcus virus 71 OX=320844 PE=4 SV=1
MM1 pKa = 7.74LLILVVNTQYY11 pKa = 10.82MSIMVLVYY19 pKa = 7.72MQQVLEE25 pKa = 4.16VVEE28 pKa = 4.47RR29 pKa = 11.84KK30 pKa = 9.58RR31 pKa = 11.84YY32 pKa = 9.2RR33 pKa = 11.84GRR35 pKa = 11.84TKK37 pKa = 9.43MRR39 pKa = 11.84TVSGILLKK47 pKa = 11.12DD48 pKa = 3.29NMLNLFGSRR57 pKa = 11.84QQ58 pKa = 3.3
MM1 pKa = 7.74LLILVVNTQYY11 pKa = 10.82MSIMVLVYY19 pKa = 7.72MQQVLEE25 pKa = 4.16VVEE28 pKa = 4.47RR29 pKa = 11.84KK30 pKa = 9.58RR31 pKa = 11.84YY32 pKa = 9.2RR33 pKa = 11.84GRR35 pKa = 11.84TKK37 pKa = 9.43MRR39 pKa = 11.84TVSGILLKK47 pKa = 11.12DD48 pKa = 3.29NMLNLFGSRR57 pKa = 11.84QQ58 pKa = 3.3
Molecular weight: 6.88 kDa
Isoelectric point according different methods:
Peptides (in silico digests for buttom-up proteomics)
Below you can find in silico digests of the whole proteome with Trypsin, Chymotrypsin, Trypsin+LysC, LysN, ArgC proteases suitable for different mass spec machines.| Try ESI |
 |
|---|
| ChTry ESI |
|
|---|
| ArgC ESI |
|
|---|
| LysN ESI |
|
|---|
| TryLysC ESI |
|
|---|
| Try MALDI |
|
|---|
| ChTry MALDI |
|
|---|
| ArgC MALDI |
|
|---|
| LysN MALDI |
|
|---|
| TryLysC MALDI |
|
|---|
| Try LTQ |
|
|---|
| ChTry LTQ |
|
|---|
| ArgC LTQ |
|
|---|
| LysN LTQ |
|
|---|
| TryLysC LTQ |
|
|---|
| Try MSlow |
|
|---|
| ChTry MSlow |
|
|---|
| ArgC MSlow |
|
|---|
| LysN MSlow |
|
|---|
| TryLysC MSlow |
|
|---|
| Try MShigh |
|
|---|
| ChTry MShigh |
|
|---|
| ArgC MShigh |
|
|---|
| LysN MShigh |
|
|---|
| TryLysC MShigh |
|
|---|
General Statistics
Number of major isoforms |
Number of additional isoforms |
Number of all proteins |
Number of amino acids |
Min. Seq. Length |
Max. Seq. Length |
Avg. Seq. Length |
Avg. Mol. Weight |
|---|---|---|---|---|---|---|---|
0 |
13903 |
36 |
989 |
193.1 |
22.08 |
Amino acid frequency
Ala |
Cys |
Asp |
Glu |
Phe |
Gly |
His |
Ile |
Lys |
Leu |
|---|---|---|---|---|---|---|---|---|---|
5.977 ± 0.372 | 0.41 ± 0.069 |
6.243 ± 0.275 | 7.236 ± 0.413 |
4.445 ± 0.233 | 5.783 ± 0.309 |
1.769 ± 0.168 | 7.883 ± 0.2 |
9.128 ± 0.342 | 7.416 ± 0.268 |
Met |
Asn |
Gln |
Pro |
Arg |
Ser |
Thr |
Val |
Trp |
Tyr |
|---|---|---|---|---|---|---|---|---|---|
2.719 ± 0.186 | 6.531 ± 0.266 |
2.733 ± 0.193 | 4.014 ± 0.184 |
4.064 ± 0.246 | 5.956 ± 0.26 |
6.092 ± 0.275 | 6.128 ± 0.289 |
1.216 ± 0.149 | 4.258 ± 0.313 |
Most of the basic statistics you can see at this page can be downloaded from this CSV file
See this proteome in:

Proteome-pI is available under Creative Commons Attribution-NoDerivs license, for more details see here
| Reference: Kozlowski LP. Proteome-pI 2.0: Proteome Isoelectric Point Database Update. Nucleic Acids Res. 2021, doi: 10.1093/nar/gkab944 | Contact: Lukasz P. Kozlowski |