Rhodovulum sp. PH10
Taxonomy: cellular organisms; Bacteria; Proteobacteria; Alphaproteobacteria; Rhodobacterales; Rhodobacteraceae; Rhodovulum; unclassified Rhodovulum
Average proteome isoelectric point is 6.88
Get precalculated fractions of proteins
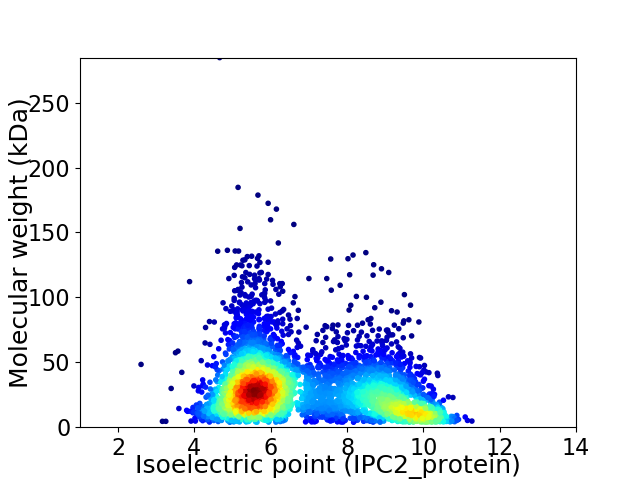
Virtual 2D-PAGE plot for 4490 proteins (isoelectric point calculated using IPC2_protein)
Get csv file with sequences according to given criteria:
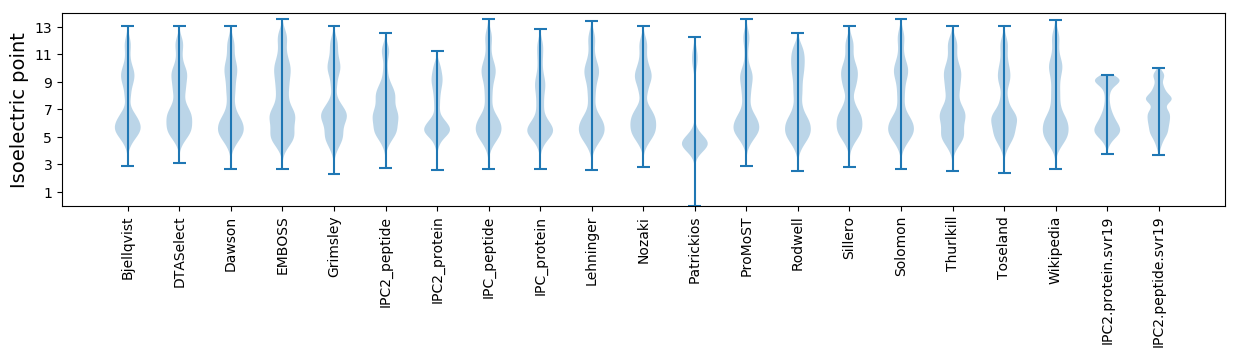
* You can choose from 21 different methods for calculating isoelectric point
Summary statistics related to proteome-wise predictions
Protein with the lowest isoelectric point:
>tr|J6UFF0|J6UFF0_9RHOB Uncharacterized protein OS=Rhodovulum sp. PH10 OX=1187851 GN=A33M_2012 PE=4 SV=1
MM1 pKa = 7.35SLSGALSSAVSALNAQSQAISMISDD26 pKa = 4.37NIANASTTGYY36 pKa = 10.15KK37 pKa = 9.92SVSASFEE44 pKa = 4.44SMLSSSTATSSYY56 pKa = 10.15SAGGVSVSTRR66 pKa = 11.84YY67 pKa = 10.18NISEE71 pKa = 3.88QGLRR75 pKa = 11.84TSSSNDD81 pKa = 2.93TAIAIEE87 pKa = 4.39GNGFFCVSDD96 pKa = 3.78GKK98 pKa = 9.33TGSASYY104 pKa = 7.66YY105 pKa = 9.2TRR107 pKa = 11.84AGDD110 pKa = 3.75FTVDD114 pKa = 3.29DD115 pKa = 4.63DD116 pKa = 5.62GYY118 pKa = 11.05LVSNGYY124 pKa = 9.38YY125 pKa = 10.43LLGWRR130 pKa = 11.84TDD132 pKa = 3.1AEE134 pKa = 4.76GNVTSGEE141 pKa = 3.96NSASLEE147 pKa = 4.3RR148 pKa = 11.84IDD150 pKa = 3.85TGTVQSIAKK159 pKa = 8.28ATTTEE164 pKa = 4.19TVEE167 pKa = 4.15ANLPADD173 pKa = 3.8AAVGDD178 pKa = 4.4TFTSTLEE185 pKa = 4.25VYY187 pKa = 10.56DD188 pKa = 4.13SLGTASNVTVTWTKK202 pKa = 8.57TAEE205 pKa = 4.29NAWSATYY212 pKa = 11.01SDD214 pKa = 4.23ATLASDD220 pKa = 3.8PSVVTGTSSGTTTITFDD237 pKa = 3.63GDD239 pKa = 3.52GNLASVTGNTLAIDD253 pKa = 3.82WTTGASDD260 pKa = 3.43SAITIDD266 pKa = 3.15VGTIGGADD274 pKa = 3.82GLTQRR279 pKa = 11.84ASGLATPAVDD289 pKa = 5.39LKK291 pKa = 11.46SIDD294 pKa = 3.83QDD296 pKa = 3.43GLAYY300 pKa = 10.4GSLTGVSIANGGDD313 pKa = 3.28VTATYY318 pKa = 11.25SNGEE322 pKa = 3.9TLVIYY327 pKa = 10.04KK328 pKa = 9.98VAVATFADD336 pKa = 4.37PNGLTTLSGGIYY348 pKa = 9.99EE349 pKa = 4.64EE350 pKa = 4.66SLASGGATLHH360 pKa = 6.06EE361 pKa = 4.93SGVGGAGDD369 pKa = 3.34IYY371 pKa = 10.85GSQLEE376 pKa = 4.54SSTADD381 pKa = 3.17TTEE384 pKa = 4.16EE385 pKa = 4.13FSTMITAQQAYY396 pKa = 9.09SAAAQVVSTVSDD408 pKa = 3.45MYY410 pKa = 10.25DD411 pKa = 3.01TLMSAVRR418 pKa = 3.81
MM1 pKa = 7.35SLSGALSSAVSALNAQSQAISMISDD26 pKa = 4.37NIANASTTGYY36 pKa = 10.15KK37 pKa = 9.92SVSASFEE44 pKa = 4.44SMLSSSTATSSYY56 pKa = 10.15SAGGVSVSTRR66 pKa = 11.84YY67 pKa = 10.18NISEE71 pKa = 3.88QGLRR75 pKa = 11.84TSSSNDD81 pKa = 2.93TAIAIEE87 pKa = 4.39GNGFFCVSDD96 pKa = 3.78GKK98 pKa = 9.33TGSASYY104 pKa = 7.66YY105 pKa = 9.2TRR107 pKa = 11.84AGDD110 pKa = 3.75FTVDD114 pKa = 3.29DD115 pKa = 4.63DD116 pKa = 5.62GYY118 pKa = 11.05LVSNGYY124 pKa = 9.38YY125 pKa = 10.43LLGWRR130 pKa = 11.84TDD132 pKa = 3.1AEE134 pKa = 4.76GNVTSGEE141 pKa = 3.96NSASLEE147 pKa = 4.3RR148 pKa = 11.84IDD150 pKa = 3.85TGTVQSIAKK159 pKa = 8.28ATTTEE164 pKa = 4.19TVEE167 pKa = 4.15ANLPADD173 pKa = 3.8AAVGDD178 pKa = 4.4TFTSTLEE185 pKa = 4.25VYY187 pKa = 10.56DD188 pKa = 4.13SLGTASNVTVTWTKK202 pKa = 8.57TAEE205 pKa = 4.29NAWSATYY212 pKa = 11.01SDD214 pKa = 4.23ATLASDD220 pKa = 3.8PSVVTGTSSGTTTITFDD237 pKa = 3.63GDD239 pKa = 3.52GNLASVTGNTLAIDD253 pKa = 3.82WTTGASDD260 pKa = 3.43SAITIDD266 pKa = 3.15VGTIGGADD274 pKa = 3.82GLTQRR279 pKa = 11.84ASGLATPAVDD289 pKa = 5.39LKK291 pKa = 11.46SIDD294 pKa = 3.83QDD296 pKa = 3.43GLAYY300 pKa = 10.4GSLTGVSIANGGDD313 pKa = 3.28VTATYY318 pKa = 11.25SNGEE322 pKa = 3.9TLVIYY327 pKa = 10.04KK328 pKa = 9.98VAVATFADD336 pKa = 4.37PNGLTTLSGGIYY348 pKa = 9.99EE349 pKa = 4.64EE350 pKa = 4.66SLASGGATLHH360 pKa = 6.06EE361 pKa = 4.93SGVGGAGDD369 pKa = 3.34IYY371 pKa = 10.85GSQLEE376 pKa = 4.54SSTADD381 pKa = 3.17TTEE384 pKa = 4.16EE385 pKa = 4.13FSTMITAQQAYY396 pKa = 9.09SAAAQVVSTVSDD408 pKa = 3.45MYY410 pKa = 10.25DD411 pKa = 3.01TLMSAVRR418 pKa = 3.81
Molecular weight: 42.25 kDa
Isoelectric point according different methods:
Protein with the highest isoelectric point:
>tr|J6LK74|J6LK74_9RHOB UDP-N-acetylmuramoylalanine--D-glutamate ligase OS=Rhodovulum sp. PH10 OX=1187851 GN=murD PE=3 SV=1
MM1 pKa = 7.36IVHH4 pKa = 7.29GGRR7 pKa = 11.84PWRR10 pKa = 11.84GAGRR14 pKa = 11.84NARR17 pKa = 11.84GTNGGTGRR25 pKa = 11.84RR26 pKa = 11.84RR27 pKa = 11.84RR28 pKa = 11.84QRR30 pKa = 11.84ARR32 pKa = 11.84RR33 pKa = 11.84AARR36 pKa = 11.84FGGGPLTAA44 pKa = 5.48
MM1 pKa = 7.36IVHH4 pKa = 7.29GGRR7 pKa = 11.84PWRR10 pKa = 11.84GAGRR14 pKa = 11.84NARR17 pKa = 11.84GTNGGTGRR25 pKa = 11.84RR26 pKa = 11.84RR27 pKa = 11.84RR28 pKa = 11.84QRR30 pKa = 11.84ARR32 pKa = 11.84RR33 pKa = 11.84AARR36 pKa = 11.84FGGGPLTAA44 pKa = 5.48
Molecular weight: 4.73 kDa
Isoelectric point according different methods:
Peptides (in silico digests for buttom-up proteomics)
Below you can find in silico digests of the whole proteome with Trypsin, Chymotrypsin, Trypsin+LysC, LysN, ArgC proteases suitable for different mass spec machines.| Try ESI |
 |
|---|
| ChTry ESI |
|
|---|
| ArgC ESI |
|
|---|
| LysN ESI |
|
|---|
| TryLysC ESI |
|
|---|
| Try MALDI |
|
|---|
| ChTry MALDI |
|
|---|
| ArgC MALDI |
|
|---|
| LysN MALDI |
|
|---|
| TryLysC MALDI |
|
|---|
| Try LTQ |
|
|---|
| ChTry LTQ |
|
|---|
| ArgC LTQ |
|
|---|
| LysN LTQ |
|
|---|
| TryLysC LTQ |
|
|---|
| Try MSlow |
|
|---|
| ChTry MSlow |
|
|---|
| ArgC MSlow |
|
|---|
| LysN MSlow |
|
|---|
| TryLysC MSlow |
|
|---|
| Try MShigh |
|
|---|
| ChTry MShigh |
|
|---|
| ArgC MShigh |
|
|---|
| LysN MShigh |
|
|---|
| TryLysC MShigh |
|
|---|
General Statistics
Number of major isoforms |
Number of additional isoforms |
Number of all proteins |
Number of amino acids |
Min. Seq. Length |
Max. Seq. Length |
Avg. Seq. Length |
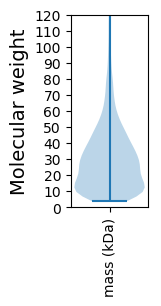
Avg. Mol. Weight |
|---|---|---|---|---|---|---|---|
0 |
1324287 |
37 |
2647 |
294.9 |
31.78 |
Amino acid frequency
Ala |
Cys |
Asp |
Glu |
Phe |
Gly |
His |
Ile |
Lys |
Leu |
|---|---|---|---|---|---|---|---|---|---|
13.718 ± 0.057 | 0.896 ± 0.012 |
5.71 ± 0.031 | 5.648 ± 0.042 |
3.486 ± 0.026 | 8.72 ± 0.035 |
2.046 ± 0.019 | 4.479 ± 0.026 |
2.975 ± 0.028 | 9.899 ± 0.05 |
Met |
Asn |
Gln |
Pro |
Arg |
Ser |
Thr |
Val |
Trp |
Tyr |
|---|---|---|---|---|---|---|---|---|---|
2.222 ± 0.018 | 1.995 ± 0.017 |
5.884 ± 0.033 | 2.537 ± 0.022 |
8.052 ± 0.048 | 4.849 ± 0.024 |
5.515 ± 0.025 | 8.166 ± 0.031 |
1.268 ± 0.015 | 1.934 ± 0.02 |
Most of the basic statistics you can see at this page can be downloaded from this CSV file
See this proteome in:

Proteome-pI is available under Creative Commons Attribution-NoDerivs license, for more details see here
| Reference: Kozlowski LP. Proteome-pI 2.0: Proteome Isoelectric Point Database Update. Nucleic Acids Res. 2021, doi: 10.1093/nar/gkab944 | Contact: Lukasz P. Kozlowski |