Vibrio phage VD1
Taxonomy: Viruses; Duplodnaviria; Heunggongvirae; Uroviricota; Caudoviricetes; Caudovirales; Myoviridae; Peduovirinae; unclassified Peduovirinae
Average proteome isoelectric point is 6.14
Get precalculated fractions of proteins
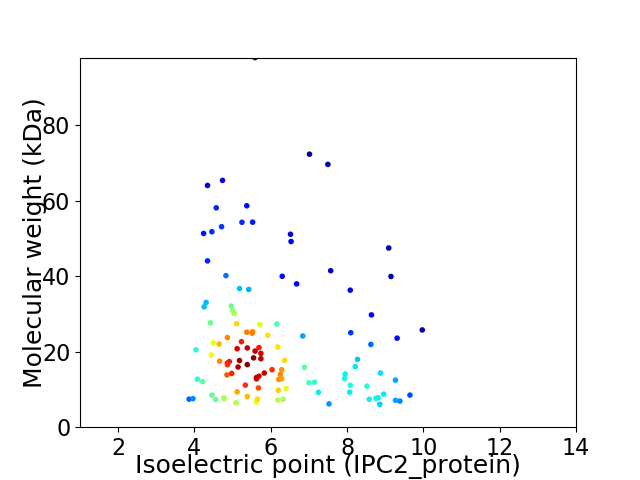
Virtual 2D-PAGE plot for 117 proteins (isoelectric point calculated using IPC2_protein)
Get csv file with sequences according to given criteria:
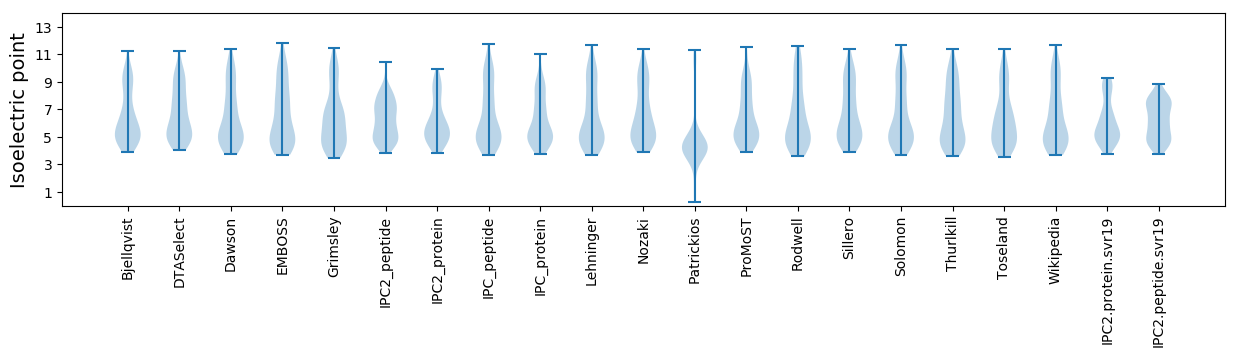
* You can choose from 21 different methods for calculating isoelectric point
Summary statistics related to proteome-wise predictions
Protein with the lowest isoelectric point:
>tr|R9TR65|R9TR65_9CAUD Major tail tube protein OS=Vibrio phage VD1 OX=754057 GN=VPPG_00052 PE=4 SV=1
MM1 pKa = 7.53AKK3 pKa = 10.33LYY5 pKa = 7.82RR6 pKa = 11.84TRR8 pKa = 11.84DD9 pKa = 3.03GDD11 pKa = 3.76MLDD14 pKa = 4.35AICYY18 pKa = 9.54SEE20 pKa = 4.72YY21 pKa = 10.23GTEE24 pKa = 3.94QAVTIVLDD32 pKa = 4.22ANPGLAEE39 pKa = 4.24NGAKK43 pKa = 10.47FSAGVQIVLPDD54 pKa = 3.4YY55 pKa = 8.96TPPAEE60 pKa = 4.2EE61 pKa = 5.27DD62 pKa = 3.73EE63 pKa = 4.52DD64 pKa = 4.41VLWSS68 pKa = 3.61
MM1 pKa = 7.53AKK3 pKa = 10.33LYY5 pKa = 7.82RR6 pKa = 11.84TRR8 pKa = 11.84DD9 pKa = 3.03GDD11 pKa = 3.76MLDD14 pKa = 4.35AICYY18 pKa = 9.54SEE20 pKa = 4.72YY21 pKa = 10.23GTEE24 pKa = 3.94QAVTIVLDD32 pKa = 4.22ANPGLAEE39 pKa = 4.24NGAKK43 pKa = 10.47FSAGVQIVLPDD54 pKa = 3.4YY55 pKa = 8.96TPPAEE60 pKa = 4.2EE61 pKa = 5.27DD62 pKa = 3.73EE63 pKa = 4.52DD64 pKa = 4.41VLWSS68 pKa = 3.61
Molecular weight: 7.43 kDa
Isoelectric point according different methods:
Protein with the highest isoelectric point:
>tr|R9TRB3|R9TRB3_9CAUD Uncharacterized protein OS=Vibrio phage VD1 OX=754057 GN=VPPG_00108 PE=4 SV=1
GG1 pKa = 6.64SRR3 pKa = 11.84SRR5 pKa = 11.84LIVEE9 pKa = 3.91INGVISMKK17 pKa = 10.45TFIQKK22 pKa = 9.78HH23 pKa = 4.61ALKK26 pKa = 10.4IGASVSAVVASGVANATVEE45 pKa = 4.19EE46 pKa = 4.39SLNAAVSSGQSNYY59 pKa = 10.44SIVVIGLIGLAAIGFGLRR77 pKa = 11.84AIMGAMRR84 pKa = 4.74
GG1 pKa = 6.64SRR3 pKa = 11.84SRR5 pKa = 11.84LIVEE9 pKa = 3.91INGVISMKK17 pKa = 10.45TFIQKK22 pKa = 9.78HH23 pKa = 4.61ALKK26 pKa = 10.4IGASVSAVVASGVANATVEE45 pKa = 4.19EE46 pKa = 4.39SLNAAVSSGQSNYY59 pKa = 10.44SIVVIGLIGLAAIGFGLRR77 pKa = 11.84AIMGAMRR84 pKa = 4.74
Molecular weight: 8.5 kDa
Isoelectric point according different methods:
Peptides (in silico digests for buttom-up proteomics)
Below you can find in silico digests of the whole proteome with Trypsin, Chymotrypsin, Trypsin+LysC, LysN, ArgC proteases suitable for different mass spec machines.| Try ESI |
 |
|---|
| ChTry ESI |
|
|---|
| ArgC ESI |
|
|---|
| LysN ESI |
|
|---|
| TryLysC ESI |
|
|---|
| Try MALDI |
|
|---|
| ChTry MALDI |
|
|---|
| ArgC MALDI |
|
|---|
| LysN MALDI |
|
|---|
| TryLysC MALDI |
|
|---|
| Try LTQ |
|
|---|
| ChTry LTQ |
|
|---|
| ArgC LTQ |
|
|---|
| LysN LTQ |
|
|---|
| TryLysC LTQ |
|
|---|
| Try MSlow |
|
|---|
| ChTry MSlow |
|
|---|
| ArgC MSlow |
|
|---|
| LysN MSlow |
|
|---|
| TryLysC MSlow |
|
|---|
| Try MShigh |
|
|---|
| ChTry MShigh |
|
|---|
| ArgC MShigh |
|
|---|
| LysN MShigh |
|
|---|
| TryLysC MShigh |
|
|---|
General Statistics
Number of major isoforms |
Number of additional isoforms |
Number of all proteins |
Number of amino acids |
Min. Seq. Length |
Max. Seq. Length |
Avg. Seq. Length |
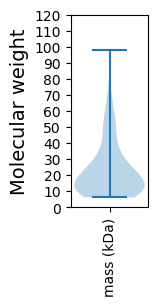
Avg. Mol. Weight |
|---|---|---|---|---|---|---|---|
0 |
24514 |
53 |
844 |
209.5 |
23.47 |
Amino acid frequency
Ala |
Cys |
Asp |
Glu |
Phe |
Gly |
His |
Ile |
Lys |
Leu |
|---|---|---|---|---|---|---|---|---|---|
8.277 ± 0.323 | 1.15 ± 0.12 |
5.817 ± 0.135 | 7.106 ± 0.235 |
3.916 ± 0.164 | 6.555 ± 0.236 |
2.027 ± 0.155 | 5.862 ± 0.166 |
6.319 ± 0.237 | 8.518 ± 0.237 |
Met |
Asn |
Gln |
Pro |
Arg |
Ser |
Thr |
Val |
Trp |
Tyr |
|---|---|---|---|---|---|---|---|---|---|
2.917 ± 0.149 | 4.516 ± 0.126 |
3.647 ± 0.137 | 4.291 ± 0.167 |
4.74 ± 0.217 | 6.865 ± 0.207 |
5.919 ± 0.188 | 6.694 ± 0.202 |
1.566 ± 0.095 | 3.296 ± 0.149 |
Most of the basic statistics you can see at this page can be downloaded from this CSV file
See this proteome in:

Proteome-pI is available under Creative Commons Attribution-NoDerivs license, for more details see here
| Reference: Kozlowski LP. Proteome-pI 2.0: Proteome Isoelectric Point Database Update. Nucleic Acids Res. 2021, doi: 10.1093/nar/gkab944 | Contact: Lukasz P. Kozlowski |