Mycoplasma agassizii
Taxonomy: cellular organisms; Bacteria; Terrabacteria group; Tenericutes; Mollicutes; Mycoplasmatales; Mycoplasmataceae; Mycoplasmopsis
Average proteome isoelectric point is 7.18
Get precalculated fractions of proteins
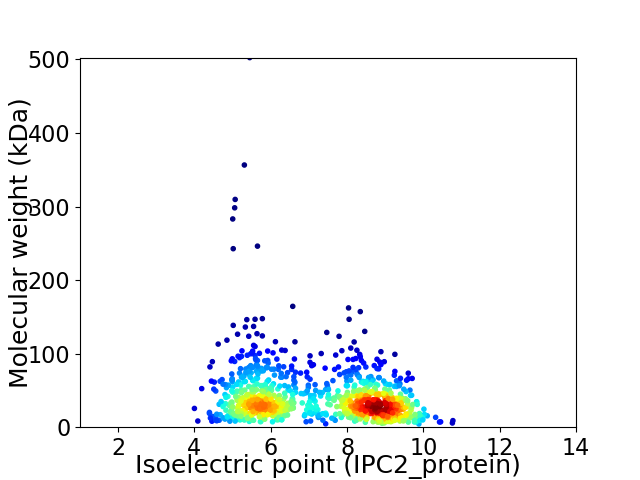
Virtual 2D-PAGE plot for 955 proteins (isoelectric point calculated using IPC2_protein)
Get csv file with sequences according to given criteria:
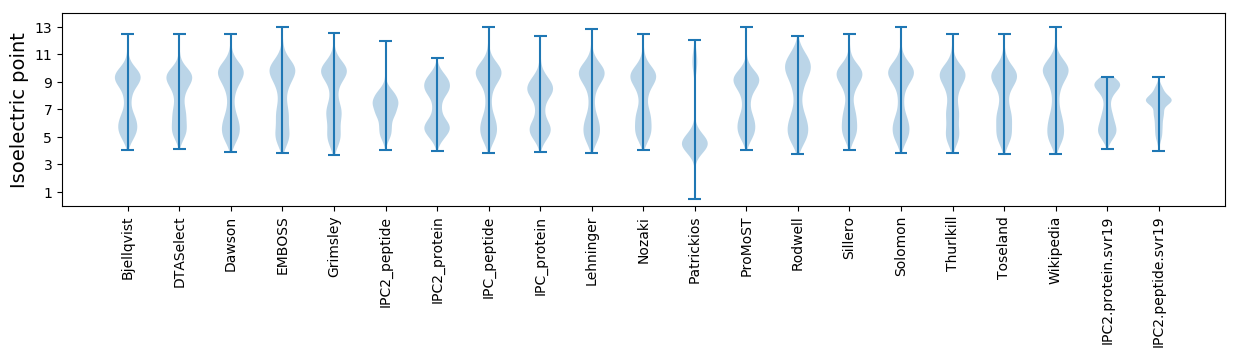
* You can choose from 21 different methods for calculating isoelectric point
Summary statistics related to proteome-wise predictions
Protein with the lowest isoelectric point:
>tr|A0A269THY3|A0A269THY3_9MOLU Methionine adenosyltransferase OS=Mycoplasma agassizii OX=33922 GN=CJJ23_03955 PE=3 SV=1
MM1 pKa = 7.74ALLSILVVFEE11 pKa = 4.01YY12 pKa = 10.47TSAPFFVSEE21 pKa = 5.12LLLQATSEE29 pKa = 4.17ITTSEE34 pKa = 4.06LSSILVIVNNNHH46 pKa = 6.32LFLNFWVCEE55 pKa = 3.87RR56 pKa = 11.84NIWITFQYY64 pKa = 11.06LFGFEE69 pKa = 3.91II70 pKa = 4.47
MM1 pKa = 7.74ALLSILVVFEE11 pKa = 4.01YY12 pKa = 10.47TSAPFFVSEE21 pKa = 5.12LLLQATSEE29 pKa = 4.17ITTSEE34 pKa = 4.06LSSILVIVNNNHH46 pKa = 6.32LFLNFWVCEE55 pKa = 3.87RR56 pKa = 11.84NIWITFQYY64 pKa = 11.06LFGFEE69 pKa = 3.91II70 pKa = 4.47
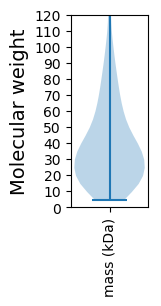
Molecular weight: 8.14 kDa
Isoelectric point according different methods:
Protein with the highest isoelectric point:
>tr|A0A269THZ9|A0A269THZ9_9MOLU Uncharacterized protein OS=Mycoplasma agassizii OX=33922 GN=CJJ23_04085 PE=4 SV=1
MM1 pKa = 7.39FKK3 pKa = 10.55NRR5 pKa = 11.84SARR8 pKa = 11.84VRR10 pKa = 11.84KK11 pKa = 9.02IRR13 pKa = 11.84KK14 pKa = 9.42RR15 pKa = 11.84NWLWKK20 pKa = 9.87QLVLFFKK27 pKa = 10.01EE28 pKa = 4.38LKK30 pKa = 9.37RR31 pKa = 11.84VRR33 pKa = 11.84WPKK36 pKa = 9.69TRR38 pKa = 11.84TSTHH42 pKa = 5.24QFLKK46 pKa = 10.55IIIFTIVFSLFVLAVATASSSVLNALGVGVV76 pKa = 4.1
MM1 pKa = 7.39FKK3 pKa = 10.55NRR5 pKa = 11.84SARR8 pKa = 11.84VRR10 pKa = 11.84KK11 pKa = 9.02IRR13 pKa = 11.84KK14 pKa = 9.42RR15 pKa = 11.84NWLWKK20 pKa = 9.87QLVLFFKK27 pKa = 10.01EE28 pKa = 4.38LKK30 pKa = 9.37RR31 pKa = 11.84VRR33 pKa = 11.84WPKK36 pKa = 9.69TRR38 pKa = 11.84TSTHH42 pKa = 5.24QFLKK46 pKa = 10.55IIIFTIVFSLFVLAVATASSSVLNALGVGVV76 pKa = 4.1
Molecular weight: 8.95 kDa
Isoelectric point according different methods:
Peptides (in silico digests for buttom-up proteomics)
Below you can find in silico digests of the whole proteome with Trypsin, Chymotrypsin, Trypsin+LysC, LysN, ArgC proteases suitable for different mass spec machines.| Try ESI |
 |
|---|
| ChTry ESI |
|
|---|
| ArgC ESI |
|
|---|
| LysN ESI |
|
|---|
| TryLysC ESI |
|
|---|
| Try MALDI |
|
|---|
| ChTry MALDI |
|
|---|
| ArgC MALDI |
|
|---|
| LysN MALDI |
|
|---|
| TryLysC MALDI |
|
|---|
| Try LTQ |
|
|---|
| ChTry LTQ |
|
|---|
| ArgC LTQ |
|
|---|
| LysN LTQ |
|
|---|
| TryLysC LTQ |
|
|---|
| Try MSlow |
|
|---|
| ChTry MSlow |
|
|---|
| ArgC MSlow |
|
|---|
| LysN MSlow |
|
|---|
| TryLysC MSlow |
|
|---|
| Try MShigh |
|
|---|
| ChTry MShigh |
|
|---|
| ArgC MShigh |
|
|---|
| LysN MShigh |
|
|---|
| TryLysC MShigh |
|
|---|
General Statistics
Number of major isoforms |
Number of additional isoforms |
Number of all proteins |
Number of amino acids |
Min. Seq. Length |
Max. Seq. Length |
Avg. Seq. Length |
Avg. Mol. Weight |
|---|---|---|---|---|---|---|---|
0 |
356451 |
37 |
4582 |
373.2 |
42.5 |
Amino acid frequency
Ala |
Cys |
Asp |
Glu |
Phe |
Gly |
His |
Ile |
Lys |
Leu |
|---|---|---|---|---|---|---|---|---|---|
6.014 ± 0.093 | 0.228 ± 0.011 |
5.628 ± 0.057 | 6.54 ± 0.095 |
5.401 ± 0.069 | 4.684 ± 0.072 |
1.43 ± 0.03 | 8.569 ± 0.09 |
9.53 ± 0.109 | 9.493 ± 0.068 |
Met |
Asn |
Gln |
Pro |
Arg |
Ser |
Thr |
Val |
Trp |
Tyr |
|---|---|---|---|---|---|---|---|---|---|
1.629 ± 0.036 | 7.43 ± 0.091 |
2.689 ± 0.048 | 3.297 ± 0.057 |
3.079 ± 0.053 | 7.296 ± 0.086 |
5.965 ± 0.114 | 6.017 ± 0.063 |
1.058 ± 0.024 | 4.025 ± 0.056 |
Most of the basic statistics you can see at this page can be downloaded from this CSV file
See this proteome in:

Proteome-pI is available under Creative Commons Attribution-NoDerivs license, for more details see here
| Reference: Kozlowski LP. Proteome-pI 2.0: Proteome Isoelectric Point Database Update. Nucleic Acids Res. 2021, doi: 10.1093/nar/gkab944 | Contact: Lukasz P. Kozlowski |