Clostridium sp. CAG:356
Taxonomy: cellular organisms; Bacteria; Terrabacteria group; Firmicutes; Clostridia; Eubacteriales; Clostridiaceae; Clostridium; environmental samples
Average proteome isoelectric point is 6.53
Get precalculated fractions of proteins
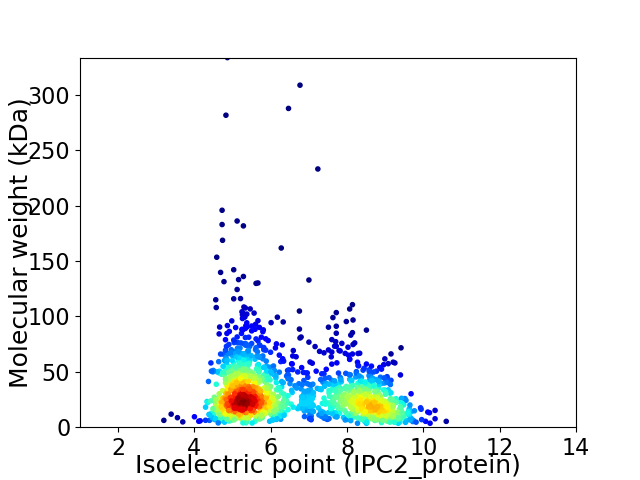
Virtual 2D-PAGE plot for 1500 proteins (isoelectric point calculated using IPC2_protein)
Get csv file with sequences according to given criteria:
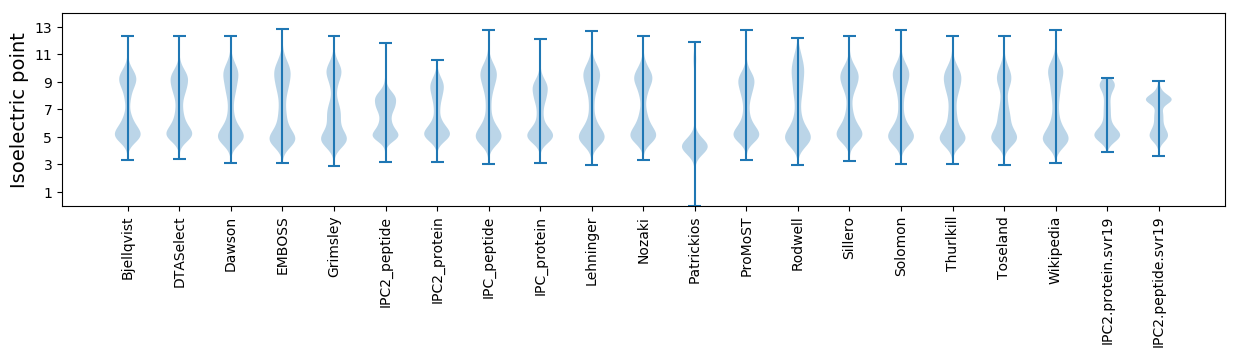
* You can choose from 21 different methods for calculating isoelectric point
Summary statistics related to proteome-wise predictions
Protein with the lowest isoelectric point:
>tr|R6YR65|R6YR65_9CLOT Uncharacterized protein OS=Clostridium sp. CAG:356 OX=1262800 GN=BN624_00196 PE=4 SV=1
MM1 pKa = 7.57NSNNCSGNNLIALASSLAVVIGNEE25 pKa = 3.71YY26 pKa = 8.8DD27 pKa = 3.68TNEE30 pKa = 4.06LSILAAFFTALGDD43 pKa = 3.83NLALIAATRR52 pKa = 3.49
MM1 pKa = 7.57NSNNCSGNNLIALASSLAVVIGNEE25 pKa = 3.71YY26 pKa = 8.8DD27 pKa = 3.68TNEE30 pKa = 4.06LSILAAFFTALGDD43 pKa = 3.83NLALIAATRR52 pKa = 3.49
Molecular weight: 5.37 kDa
Isoelectric point according different methods:
Protein with the highest isoelectric point:
>tr|R6YNK2|R6YNK2_9CLOT Uncharacterized protein OS=Clostridium sp. CAG:356 OX=1262800 GN=BN624_01272 PE=4 SV=1
MM1 pKa = 7.62AKK3 pKa = 10.05KK4 pKa = 10.21SLKK7 pKa = 9.9IKK9 pKa = 8.35QARR12 pKa = 11.84PQKK15 pKa = 10.09YY16 pKa = 7.6ATRR19 pKa = 11.84EE20 pKa = 3.78YY21 pKa = 10.59NRR23 pKa = 11.84CKK25 pKa = 10.14ICGRR29 pKa = 11.84PHH31 pKa = 7.33AYY33 pKa = 8.2IRR35 pKa = 11.84KK36 pKa = 8.51YY37 pKa = 10.46GICRR41 pKa = 11.84VCFRR45 pKa = 11.84EE46 pKa = 4.0LAHH49 pKa = 6.83KK50 pKa = 11.06GEE52 pKa = 4.16IPGVKK57 pKa = 9.3KK58 pKa = 10.94ASWW61 pKa = 3.03
MM1 pKa = 7.62AKK3 pKa = 10.05KK4 pKa = 10.21SLKK7 pKa = 9.9IKK9 pKa = 8.35QARR12 pKa = 11.84PQKK15 pKa = 10.09YY16 pKa = 7.6ATRR19 pKa = 11.84EE20 pKa = 3.78YY21 pKa = 10.59NRR23 pKa = 11.84CKK25 pKa = 10.14ICGRR29 pKa = 11.84PHH31 pKa = 7.33AYY33 pKa = 8.2IRR35 pKa = 11.84KK36 pKa = 8.51YY37 pKa = 10.46GICRR41 pKa = 11.84VCFRR45 pKa = 11.84EE46 pKa = 4.0LAHH49 pKa = 6.83KK50 pKa = 11.06GEE52 pKa = 4.16IPGVKK57 pKa = 9.3KK58 pKa = 10.94ASWW61 pKa = 3.03
Molecular weight: 7.17 kDa
Isoelectric point according different methods:
Peptides (in silico digests for buttom-up proteomics)
Below you can find in silico digests of the whole proteome with Trypsin, Chymotrypsin, Trypsin+LysC, LysN, ArgC proteases suitable for different mass spec machines.| Try ESI |
 |
|---|
| ChTry ESI |
|
|---|
| ArgC ESI |
|
|---|
| LysN ESI |
|
|---|
| TryLysC ESI |
|
|---|
| Try MALDI |
|
|---|
| ChTry MALDI |
|
|---|
| ArgC MALDI |
|
|---|
| LysN MALDI |
|
|---|
| TryLysC MALDI |
|
|---|
| Try LTQ |
|
|---|
| ChTry LTQ |
|
|---|
| ArgC LTQ |
|
|---|
| LysN LTQ |
|
|---|
| TryLysC LTQ |
|
|---|
| Try MSlow |
|
|---|
| ChTry MSlow |
|
|---|
| ArgC MSlow |
|
|---|
| LysN MSlow |
|
|---|
| TryLysC MSlow |
|
|---|
| Try MShigh |
|
|---|
| ChTry MShigh |
|
|---|
| ArgC MShigh |
|
|---|
| LysN MShigh |
|
|---|
| TryLysC MShigh |
|
|---|
General Statistics
Number of major isoforms |
Number of additional isoforms |
Number of all proteins |
Number of amino acids |
Min. Seq. Length |
Max. Seq. Length |
Avg. Seq. Length |
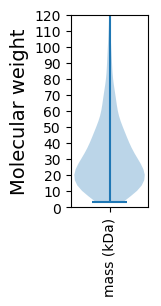
Avg. Mol. Weight |
|---|---|---|---|---|---|---|---|
0 |
450784 |
29 |
2992 |
300.5 |
34.27 |
Amino acid frequency
Ala |
Cys |
Asp |
Glu |
Phe |
Gly |
His |
Ile |
Lys |
Leu |
|---|---|---|---|---|---|---|---|---|---|
5.276 ± 0.053 | 1.087 ± 0.024 |
5.539 ± 0.06 | 8.536 ± 0.075 |
3.836 ± 0.049 | 5.63 ± 0.062 |
1.197 ± 0.024 | 10.055 ± 0.079 |
10.107 ± 0.066 | 8.157 ± 0.073 |
Met |
Asn |
Gln |
Pro |
Arg |
Ser |
Thr |
Val |
Trp |
Tyr |
|---|---|---|---|---|---|---|---|---|---|
2.523 ± 0.036 | 6.78 ± 0.07 |
2.503 ± 0.029 | 2.995 ± 0.031 |
3.291 ± 0.044 | 5.602 ± 0.055 |
5.661 ± 0.087 | 6.079 ± 0.059 |
0.676 ± 0.021 | 4.469 ± 0.055 |
Most of the basic statistics you can see at this page can be downloaded from this CSV file
See this proteome in:

Proteome-pI is available under Creative Commons Attribution-NoDerivs license, for more details see here
| Reference: Kozlowski LP. Proteome-pI 2.0: Proteome Isoelectric Point Database Update. Nucleic Acids Res. 2021, doi: 10.1093/nar/gkab944 | Contact: Lukasz P. Kozlowski |