Bartonella tamiae Th239
Taxonomy: cellular organisms; Bacteria; Proteobacteria; Alphaproteobacteria; Hyphomicrobiales; Bartonellaceae; Bartonella; Bartonella tamiae
Average proteome isoelectric point is 6.78
Get precalculated fractions of proteins
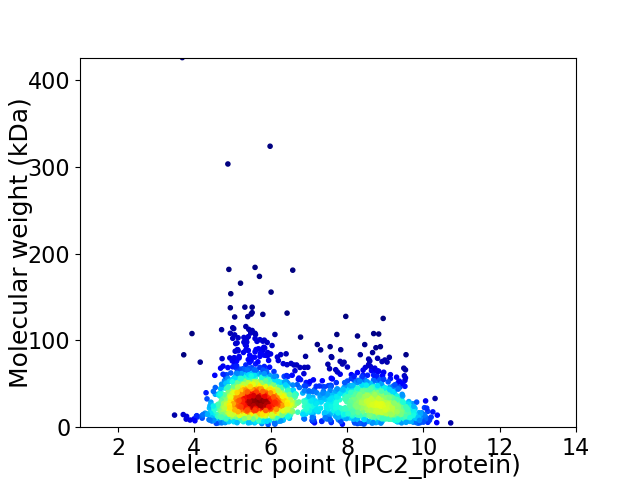
Virtual 2D-PAGE plot for 1978 proteins (isoelectric point calculated using IPC2_protein)
Get csv file with sequences according to given criteria:
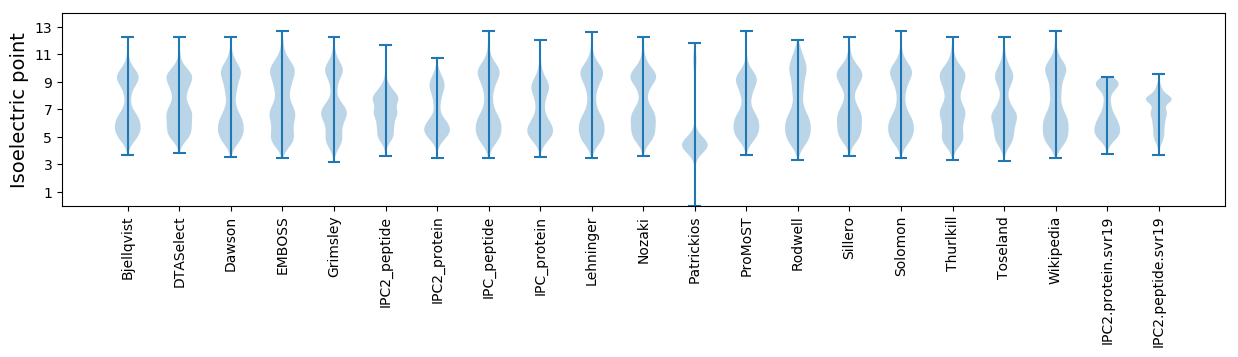
* You can choose from 21 different methods for calculating isoelectric point
Summary statistics related to proteome-wise predictions
Protein with the lowest isoelectric point:
>tr|J0R7F7|J0R7F7_9RHIZ Uncharacterized protein OS=Bartonella tamiae Th239 OX=1094558 GN=ME5_00048 PE=4 SV=1
MM1 pKa = 7.7AYY3 pKa = 9.18IYY5 pKa = 10.74YY6 pKa = 10.17SIPLFNDD13 pKa = 2.73NGRR16 pKa = 11.84QISEE20 pKa = 4.24LDD22 pKa = 3.48GKK24 pKa = 10.73VEE26 pKa = 4.39FSVGLDD32 pKa = 3.05NGEE35 pKa = 4.01PFAEE39 pKa = 4.36IDD41 pKa = 4.64CIYY44 pKa = 11.16ADD46 pKa = 4.0DD47 pKa = 4.38FEE49 pKa = 5.59GFEE52 pKa = 4.12ICYY55 pKa = 9.93SANSDD60 pKa = 3.74TPFDD64 pKa = 3.51LTVFLRR70 pKa = 11.84AKK72 pKa = 10.08EE73 pKa = 3.89YY74 pKa = 11.19LEE76 pKa = 4.85QSDD79 pKa = 4.4AFQNEE84 pKa = 4.67AINEE88 pKa = 4.4DD89 pKa = 3.4GSFVYY94 pKa = 10.07EE95 pKa = 4.07GRR97 pKa = 11.84GSNDD101 pKa = 2.91PDD103 pKa = 3.9GYY105 pKa = 10.12FKK107 pKa = 10.77RR108 pKa = 11.84VAA110 pKa = 3.45
MM1 pKa = 7.7AYY3 pKa = 9.18IYY5 pKa = 10.74YY6 pKa = 10.17SIPLFNDD13 pKa = 2.73NGRR16 pKa = 11.84QISEE20 pKa = 4.24LDD22 pKa = 3.48GKK24 pKa = 10.73VEE26 pKa = 4.39FSVGLDD32 pKa = 3.05NGEE35 pKa = 4.01PFAEE39 pKa = 4.36IDD41 pKa = 4.64CIYY44 pKa = 11.16ADD46 pKa = 4.0DD47 pKa = 4.38FEE49 pKa = 5.59GFEE52 pKa = 4.12ICYY55 pKa = 9.93SANSDD60 pKa = 3.74TPFDD64 pKa = 3.51LTVFLRR70 pKa = 11.84AKK72 pKa = 10.08EE73 pKa = 3.89YY74 pKa = 11.19LEE76 pKa = 4.85QSDD79 pKa = 4.4AFQNEE84 pKa = 4.67AINEE88 pKa = 4.4DD89 pKa = 3.4GSFVYY94 pKa = 10.07EE95 pKa = 4.07GRR97 pKa = 11.84GSNDD101 pKa = 2.91PDD103 pKa = 3.9GYY105 pKa = 10.12FKK107 pKa = 10.77RR108 pKa = 11.84VAA110 pKa = 3.45
Molecular weight: 12.46 kDa
Isoelectric point according different methods:
Protein with the highest isoelectric point:
>tr|J1K0T5|J1K0T5_9RHIZ 30S ribosomal protein S18 OS=Bartonella tamiae Th239 OX=1094558 GN=rpsR PE=3 SV=1
MM1 pKa = 7.2QVNLKK6 pKa = 10.31RR7 pKa = 11.84KK8 pKa = 7.92AQEE11 pKa = 3.69RR12 pKa = 11.84QSFVTIIVVRR22 pKa = 11.84RR23 pKa = 11.84RR24 pKa = 11.84MGQRR28 pKa = 11.84SQGILAIGQNRR39 pKa = 11.84FICALGASGIVSQKK53 pKa = 10.57YY54 pKa = 9.45EE55 pKa = 4.23GDD57 pKa = 3.45GATPRR62 pKa = 11.84GVMKK66 pKa = 10.39VLQGFRR72 pKa = 11.84QKK74 pKa = 10.58NVHH77 pKa = 6.21SRR79 pKa = 11.84TKK81 pKa = 9.49HH82 pKa = 4.91CLKK85 pKa = 9.96MRR87 pKa = 11.84IIGNRR92 pKa = 11.84DD93 pKa = 2.76GWCDD97 pKa = 3.73EE98 pKa = 4.12NWDD101 pKa = 3.73ANYY104 pKa = 10.18NRR106 pKa = 11.84PVRR109 pKa = 11.84LPYY112 pKa = 9.9RR113 pKa = 11.84ASAEE117 pKa = 3.74EE118 pKa = 3.99MQRR121 pKa = 11.84KK122 pKa = 9.82DD123 pKa = 3.66EE124 pKa = 4.48IYY126 pKa = 11.3DD127 pKa = 3.22MGLIVDD133 pKa = 3.88WNIQKK138 pKa = 10.52RR139 pKa = 11.84VMNRR143 pKa = 11.84GSAIFMHH150 pKa = 7.19LARR153 pKa = 11.84KK154 pKa = 9.96GYY156 pKa = 8.3TPTRR160 pKa = 11.84GCIALSRR167 pKa = 11.84RR168 pKa = 11.84DD169 pKa = 3.51MEE171 pKa = 4.36RR172 pKa = 11.84VFTVVSNKK180 pKa = 8.28TRR182 pKa = 11.84LLILGG187 pKa = 4.04
MM1 pKa = 7.2QVNLKK6 pKa = 10.31RR7 pKa = 11.84KK8 pKa = 7.92AQEE11 pKa = 3.69RR12 pKa = 11.84QSFVTIIVVRR22 pKa = 11.84RR23 pKa = 11.84RR24 pKa = 11.84MGQRR28 pKa = 11.84SQGILAIGQNRR39 pKa = 11.84FICALGASGIVSQKK53 pKa = 10.57YY54 pKa = 9.45EE55 pKa = 4.23GDD57 pKa = 3.45GATPRR62 pKa = 11.84GVMKK66 pKa = 10.39VLQGFRR72 pKa = 11.84QKK74 pKa = 10.58NVHH77 pKa = 6.21SRR79 pKa = 11.84TKK81 pKa = 9.49HH82 pKa = 4.91CLKK85 pKa = 9.96MRR87 pKa = 11.84IIGNRR92 pKa = 11.84DD93 pKa = 2.76GWCDD97 pKa = 3.73EE98 pKa = 4.12NWDD101 pKa = 3.73ANYY104 pKa = 10.18NRR106 pKa = 11.84PVRR109 pKa = 11.84LPYY112 pKa = 9.9RR113 pKa = 11.84ASAEE117 pKa = 3.74EE118 pKa = 3.99MQRR121 pKa = 11.84KK122 pKa = 9.82DD123 pKa = 3.66EE124 pKa = 4.48IYY126 pKa = 11.3DD127 pKa = 3.22MGLIVDD133 pKa = 3.88WNIQKK138 pKa = 10.52RR139 pKa = 11.84VMNRR143 pKa = 11.84GSAIFMHH150 pKa = 7.19LARR153 pKa = 11.84KK154 pKa = 9.96GYY156 pKa = 8.3TPTRR160 pKa = 11.84GCIALSRR167 pKa = 11.84RR168 pKa = 11.84DD169 pKa = 3.51MEE171 pKa = 4.36RR172 pKa = 11.84VFTVVSNKK180 pKa = 8.28TRR182 pKa = 11.84LLILGG187 pKa = 4.04
Molecular weight: 21.57 kDa
Isoelectric point according different methods:
Peptides (in silico digests for buttom-up proteomics)
Below you can find in silico digests of the whole proteome with Trypsin, Chymotrypsin, Trypsin+LysC, LysN, ArgC proteases suitable for different mass spec machines.| Try ESI |
 |
|---|
| ChTry ESI |
|
|---|
| ArgC ESI |
|
|---|
| LysN ESI |
|
|---|
| TryLysC ESI |
|
|---|
| Try MALDI |
|
|---|
| ChTry MALDI |
|
|---|
| ArgC MALDI |
|
|---|
| LysN MALDI |
|
|---|
| TryLysC MALDI |
|
|---|
| Try LTQ |
|
|---|
| ChTry LTQ |
|
|---|
| ArgC LTQ |
|
|---|
| LysN LTQ |
|
|---|
| TryLysC LTQ |
|
|---|
| Try MSlow |
|
|---|
| ChTry MSlow |
|
|---|
| ArgC MSlow |
|
|---|
| LysN MSlow |
|
|---|
| TryLysC MSlow |
|
|---|
| Try MShigh |
|
|---|
| ChTry MShigh |
|
|---|
| ArgC MShigh |
|
|---|
| LysN MShigh |
|
|---|
| TryLysC MShigh |
|
|---|
General Statistics
Number of major isoforms |
Number of additional isoforms |
Number of all proteins |
Number of amino acids |
Min. Seq. Length |
Max. Seq. Length |
Avg. Seq. Length |
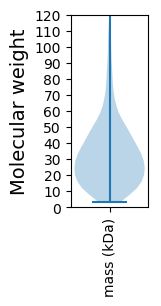
Avg. Mol. Weight |
|---|---|---|---|---|---|---|---|
0 |
619200 |
30 |
4052 |
313.0 |
34.82 |
Amino acid frequency
Ala |
Cys |
Asp |
Glu |
Phe |
Gly |
His |
Ile |
Lys |
Leu |
|---|---|---|---|---|---|---|---|---|---|
8.719 ± 0.056 | 0.883 ± 0.018 |
5.794 ± 0.049 | 5.681 ± 0.056 |
4.422 ± 0.043 | 7.053 ± 0.071 |
2.423 ± 0.028 | 7.535 ± 0.047 |
5.741 ± 0.056 | 9.84 ± 0.066 |
Met |
Asn |
Gln |
Pro |
Arg |
Ser |
Thr |
Val |
Trp |
Tyr |
|---|---|---|---|---|---|---|---|---|---|
2.605 ± 0.029 | 4.425 ± 0.058 |
4.004 ± 0.033 | 3.813 ± 0.037 |
5.234 ± 0.055 | 6.216 ± 0.047 |
5.351 ± 0.05 | 6.331 ± 0.046 |
1.121 ± 0.022 | 2.81 ± 0.036 |
Most of the basic statistics you can see at this page can be downloaded from this CSV file
See this proteome in:

Proteome-pI is available under Creative Commons Attribution-NoDerivs license, for more details see here
| Reference: Kozlowski LP. Proteome-pI 2.0: Proteome Isoelectric Point Database Update. Nucleic Acids Res. 2021, doi: 10.1093/nar/gkab944 | Contact: Lukasz P. Kozlowski |