Salmonella phage SEN1
Taxonomy: Viruses; Duplodnaviria; Heunggongvirae; Uroviricota; Caudoviricetes; Caudovirales; Myoviridae; Peduovirinae; Eganvirus; Salmonella virus SEN1
Average proteome isoelectric point is 6.36
Get precalculated fractions of proteins
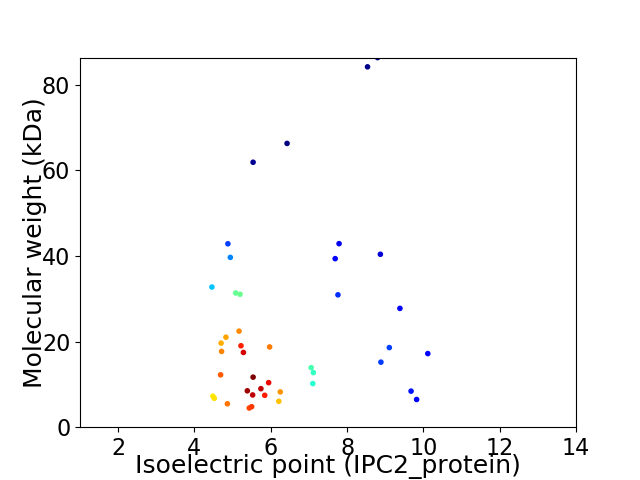
Virtual 2D-PAGE plot for 43 proteins (isoelectric point calculated using IPC2_protein)
Get csv file with sequences according to given criteria:
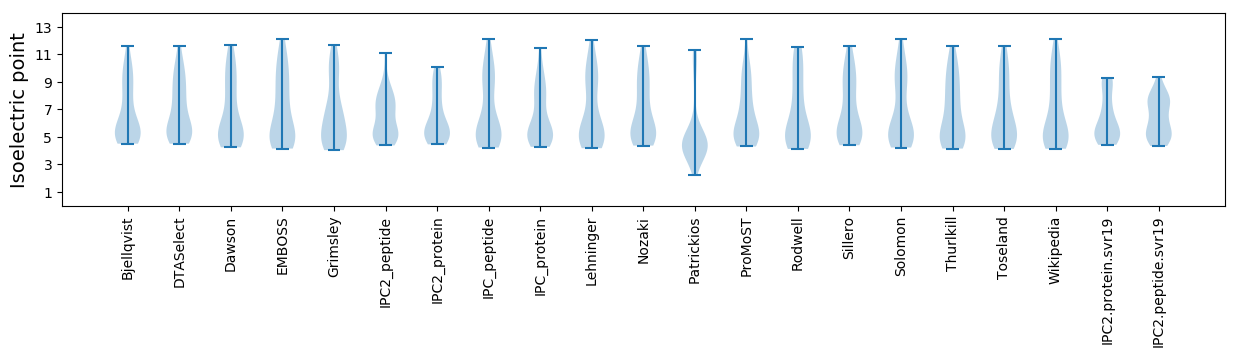
* You can choose from 21 different methods for calculating isoelectric point
Summary statistics related to proteome-wise predictions
Protein with the lowest isoelectric point:
>tr|A0A0M3ULF6|A0A0M3ULF6_9CAUD Putative tail fibers protein OS=Salmonella phage SEN1 OX=1647455 GN=SEN1_19 PE=4 SV=1
MM1 pKa = 7.66KK2 pKa = 10.07VRR4 pKa = 11.84SMQGDD9 pKa = 3.84TLDD12 pKa = 4.21VICARR17 pKa = 11.84YY18 pKa = 9.04YY19 pKa = 10.75GRR21 pKa = 11.84TEE23 pKa = 4.12GVVEE27 pKa = 4.42TVLQANPGLSEE38 pKa = 4.6LGVILPHH45 pKa = 6.21GTAIDD50 pKa = 4.16LPDD53 pKa = 3.87VPSSPVTEE61 pKa = 4.95TINLWEE67 pKa = 4.05
MM1 pKa = 7.66KK2 pKa = 10.07VRR4 pKa = 11.84SMQGDD9 pKa = 3.84TLDD12 pKa = 4.21VICARR17 pKa = 11.84YY18 pKa = 9.04YY19 pKa = 10.75GRR21 pKa = 11.84TEE23 pKa = 4.12GVVEE27 pKa = 4.42TVLQANPGLSEE38 pKa = 4.6LGVILPHH45 pKa = 6.21GTAIDD50 pKa = 4.16LPDD53 pKa = 3.87VPSSPVTEE61 pKa = 4.95TINLWEE67 pKa = 4.05
Molecular weight: 7.25 kDa
Isoelectric point according different methods:
Protein with the highest isoelectric point:
>tr|A0A0M4RCN2|A0A0M4RCN2_9CAUD Lysis protein LysC OS=Salmonella phage SEN1 OX=1647455 GN=SEN1_12 PE=4 SV=1
MM1 pKa = 7.51TNLDD5 pKa = 3.82PRR7 pKa = 11.84QLWRR11 pKa = 11.84RR12 pKa = 11.84TARR15 pKa = 11.84TGKK18 pKa = 10.2SDD20 pKa = 3.01ACKK23 pKa = 10.13TMHH26 pKa = 7.22LLHH29 pKa = 7.04ARR31 pKa = 11.84LKK33 pKa = 10.02NGKK36 pKa = 8.6FAEE39 pKa = 4.31KK40 pKa = 8.53WHH42 pKa = 6.61KK43 pKa = 9.34KK44 pKa = 8.02TGIHH48 pKa = 6.53GAGLNQVYY56 pKa = 10.25
MM1 pKa = 7.51TNLDD5 pKa = 3.82PRR7 pKa = 11.84QLWRR11 pKa = 11.84RR12 pKa = 11.84TARR15 pKa = 11.84TGKK18 pKa = 10.2SDD20 pKa = 3.01ACKK23 pKa = 10.13TMHH26 pKa = 7.22LLHH29 pKa = 7.04ARR31 pKa = 11.84LKK33 pKa = 10.02NGKK36 pKa = 8.6FAEE39 pKa = 4.31KK40 pKa = 8.53WHH42 pKa = 6.61KK43 pKa = 9.34KK44 pKa = 8.02TGIHH48 pKa = 6.53GAGLNQVYY56 pKa = 10.25
Molecular weight: 6.47 kDa
Isoelectric point according different methods:
Peptides (in silico digests for buttom-up proteomics)
Below you can find in silico digests of the whole proteome with Trypsin, Chymotrypsin, Trypsin+LysC, LysN, ArgC proteases suitable for different mass spec machines.| Try ESI |
 |
|---|
| ChTry ESI |
|
|---|
| ArgC ESI |
|
|---|
| LysN ESI |
|
|---|
| TryLysC ESI |
|
|---|
| Try MALDI |
|
|---|
| ChTry MALDI |
|
|---|
| ArgC MALDI |
|
|---|
| LysN MALDI |
|
|---|
| TryLysC MALDI |
|
|---|
| Try LTQ |
|
|---|
| ChTry LTQ |
|
|---|
| ArgC LTQ |
|
|---|
| LysN LTQ |
|
|---|
| TryLysC LTQ |
|
|---|
| Try MSlow |
|
|---|
| ChTry MSlow |
|
|---|
| ArgC MSlow |
|
|---|
| LysN MSlow |
|
|---|
| TryLysC MSlow |
|
|---|
| Try MShigh |
|
|---|
| ChTry MShigh |
|
|---|
| ArgC MShigh |
|
|---|
| LysN MShigh |
|
|---|
| TryLysC MShigh |
|
|---|
General Statistics
Number of major isoforms |
Number of additional isoforms |
Number of all proteins |
Number of amino acids |
Min. Seq. Length |
Max. Seq. Length |
Avg. Seq. Length |
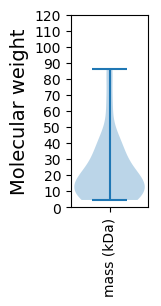
Avg. Mol. Weight |
|---|---|---|---|---|---|---|---|
0 |
9093 |
39 |
814 |
211.5 |
23.4 |
Amino acid frequency
Ala |
Cys |
Asp |
Glu |
Phe |
Gly |
His |
Ile |
Lys |
Leu |
|---|---|---|---|---|---|---|---|---|---|
10.415 ± 0.545 | 0.979 ± 0.135 |
6.137 ± 0.303 | 6.093 ± 0.3 |
3.09 ± 0.28 | 6.84 ± 0.372 |
2.002 ± 0.2 | 5.51 ± 0.202 |
5.664 ± 0.315 | 9.106 ± 0.314 |
Met |
Asn |
Gln |
Pro |
Arg |
Ser |
Thr |
Val |
Trp |
Tyr |
|---|---|---|---|---|---|---|---|---|---|
2.551 ± 0.14 | 3.915 ± 0.22 |
4.179 ± 0.223 | 3.926 ± 0.255 |
6.346 ± 0.452 | 6.214 ± 0.231 |
6.522 ± 0.434 | 6.412 ± 0.353 |
1.595 ± 0.15 | 2.507 ± 0.199 |
Most of the basic statistics you can see at this page can be downloaded from this CSV file
See this proteome in:

Proteome-pI is available under Creative Commons Attribution-NoDerivs license, for more details see here
| Reference: Kozlowski LP. Proteome-pI 2.0: Proteome Isoelectric Point Database Update. Nucleic Acids Res. 2021, doi: 10.1093/nar/gkab944 | Contact: Lukasz P. Kozlowski |