Streptococcus phage Javan336
Taxonomy: Viruses; Duplodnaviria; Heunggongvirae; Uroviricota; Caudoviricetes; Caudovirales; Myoviridae; unclassified Myoviridae
Average proteome isoelectric point is 6.61
Get precalculated fractions of proteins
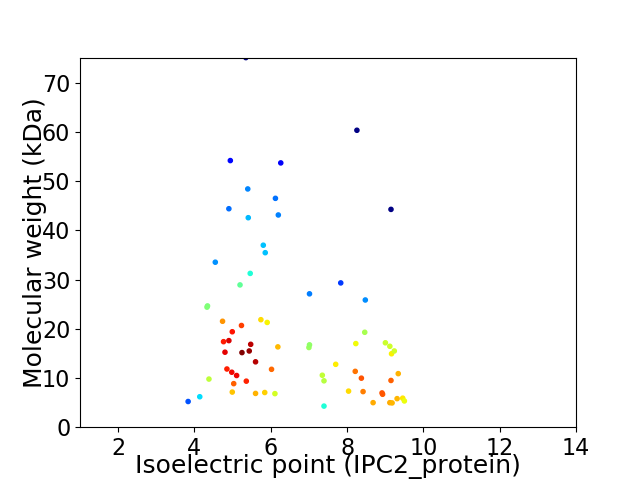
Virtual 2D-PAGE plot for 72 proteins (isoelectric point calculated using IPC2_protein)
Get csv file with sequences according to given criteria:
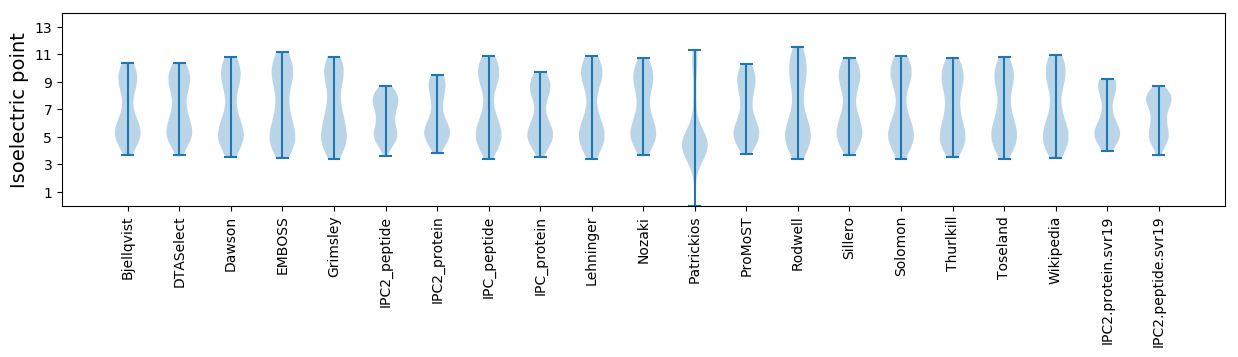
* You can choose from 21 different methods for calculating isoelectric point
Summary statistics related to proteome-wise predictions
Protein with the lowest isoelectric point:
>tr|A0A4D6AZ32|A0A4D6AZ32_9CAUD Uncharacterized protein OS=Streptococcus phage Javan336 OX=2548112 GN=Javan336_0031 PE=4 SV=1
MM1 pKa = 8.04SYY3 pKa = 10.47EE4 pKa = 4.17QISEE8 pKa = 3.97STYY11 pKa = 9.4FQNMSYY17 pKa = 9.91WNQVAQNYY25 pKa = 7.71RR26 pKa = 11.84ALGGLGICDD35 pKa = 4.23DD36 pKa = 3.94EE37 pKa = 4.7TGEE40 pKa = 4.01EE41 pKa = 5.39LYY43 pKa = 10.59TII45 pKa = 4.75
MM1 pKa = 8.04SYY3 pKa = 10.47EE4 pKa = 4.17QISEE8 pKa = 3.97STYY11 pKa = 9.4FQNMSYY17 pKa = 9.91WNQVAQNYY25 pKa = 7.71RR26 pKa = 11.84ALGGLGICDD35 pKa = 4.23DD36 pKa = 3.94EE37 pKa = 4.7TGEE40 pKa = 4.01EE41 pKa = 5.39LYY43 pKa = 10.59TII45 pKa = 4.75
Molecular weight: 5.22 kDa
Isoelectric point according different methods:
Protein with the highest isoelectric point:
>tr|A0A4D6AZ11|A0A4D6AZ11_9CAUD Uncharacterized protein OS=Streptococcus phage Javan336 OX=2548112 GN=Javan336_0011 PE=4 SV=1
MM1 pKa = 7.59SKK3 pKa = 8.46ITLDD7 pKa = 3.27QAKK10 pKa = 9.37IDD12 pKa = 3.74MYY14 pKa = 11.33INLLKK19 pKa = 10.63RR20 pKa = 11.84GAIDD24 pKa = 3.68FSFVNKK30 pKa = 10.08RR31 pKa = 11.84FRR33 pKa = 11.84DD34 pKa = 3.6RR35 pKa = 11.84VRR37 pKa = 11.84KK38 pKa = 8.83EE39 pKa = 3.64LEE41 pKa = 3.72RR42 pKa = 11.84LGLSNLANN50 pKa = 3.69
MM1 pKa = 7.59SKK3 pKa = 8.46ITLDD7 pKa = 3.27QAKK10 pKa = 9.37IDD12 pKa = 3.74MYY14 pKa = 11.33INLLKK19 pKa = 10.63RR20 pKa = 11.84GAIDD24 pKa = 3.68FSFVNKK30 pKa = 10.08RR31 pKa = 11.84FRR33 pKa = 11.84DD34 pKa = 3.6RR35 pKa = 11.84VRR37 pKa = 11.84KK38 pKa = 8.83EE39 pKa = 3.64LEE41 pKa = 3.72RR42 pKa = 11.84LGLSNLANN50 pKa = 3.69
Molecular weight: 5.9 kDa
Isoelectric point according different methods:
Peptides (in silico digests for buttom-up proteomics)
Below you can find in silico digests of the whole proteome with Trypsin, Chymotrypsin, Trypsin+LysC, LysN, ArgC proteases suitable for different mass spec machines.| Try ESI |
 |
|---|
| ChTry ESI |
|
|---|
| ArgC ESI |
|
|---|
| LysN ESI |
|
|---|
| TryLysC ESI |
|
|---|
| Try MALDI |
|
|---|
| ChTry MALDI |
|
|---|
| ArgC MALDI |
|
|---|
| LysN MALDI |
|
|---|
| TryLysC MALDI |
|
|---|
| Try LTQ |
|
|---|
| ChTry LTQ |
|
|---|
| ArgC LTQ |
|
|---|
| LysN LTQ |
|
|---|
| TryLysC LTQ |
|
|---|
| Try MSlow |
|
|---|
| ChTry MSlow |
|
|---|
| ArgC MSlow |
|
|---|
| LysN MSlow |
|
|---|
| TryLysC MSlow |
|
|---|
| Try MShigh |
|
|---|
| ChTry MShigh |
|
|---|
| ArgC MShigh |
|
|---|
| LysN MShigh |
|
|---|
| TryLysC MShigh |
|
|---|
General Statistics
Number of major isoforms |
Number of additional isoforms |
Number of all proteins |
Number of amino acids |
Min. Seq. Length |
Max. Seq. Length |
Avg. Seq. Length |
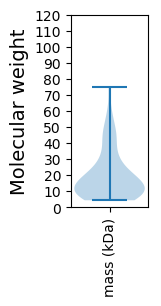
Avg. Mol. Weight |
|---|---|---|---|---|---|---|---|
0 |
12538 |
37 |
705 |
174.1 |
19.82 |
Amino acid frequency
Ala |
Cys |
Asp |
Glu |
Phe |
Gly |
His |
Ile |
Lys |
Leu |
|---|---|---|---|---|---|---|---|---|---|
6.373 ± 0.45 | 0.646 ± 0.097 |
6.325 ± 0.279 | 8.048 ± 0.443 |
3.9 ± 0.197 | 6.452 ± 0.392 |
1.595 ± 0.166 | 6.771 ± 0.235 |
8.821 ± 0.396 | 8.359 ± 0.352 |
Met |
Asn |
Gln |
Pro |
Arg |
Ser |
Thr |
Val |
Trp |
Tyr |
|---|---|---|---|---|---|---|---|---|---|
2.592 ± 0.252 | 5.176 ± 0.242 |
2.632 ± 0.236 | 4.028 ± 0.182 |
4.602 ± 0.253 | 5.615 ± 0.27 |
5.982 ± 0.275 | 6.835 ± 0.294 |
1.3 ± 0.155 | 3.948 ± 0.259 |
Most of the basic statistics you can see at this page can be downloaded from this CSV file
See this proteome in:

Proteome-pI is available under Creative Commons Attribution-NoDerivs license, for more details see here
| Reference: Kozlowski LP. Proteome-pI 2.0: Proteome Isoelectric Point Database Update. Nucleic Acids Res. 2021, doi: 10.1093/nar/gkab944 | Contact: Lukasz P. Kozlowski |