Streptococcus satellite phage Javan734
Taxonomy: Viruses; unclassified bacterial viruses
Average proteome isoelectric point is 6.94
Get precalculated fractions of proteins
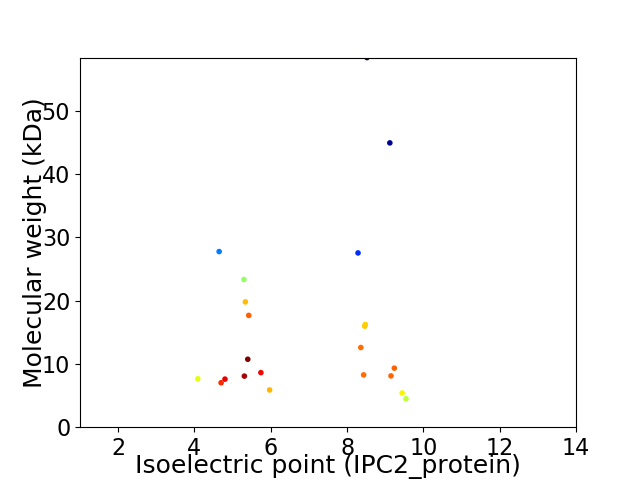
Virtual 2D-PAGE plot for 22 proteins (isoelectric point calculated using IPC2_protein)
Get csv file with sequences according to given criteria:
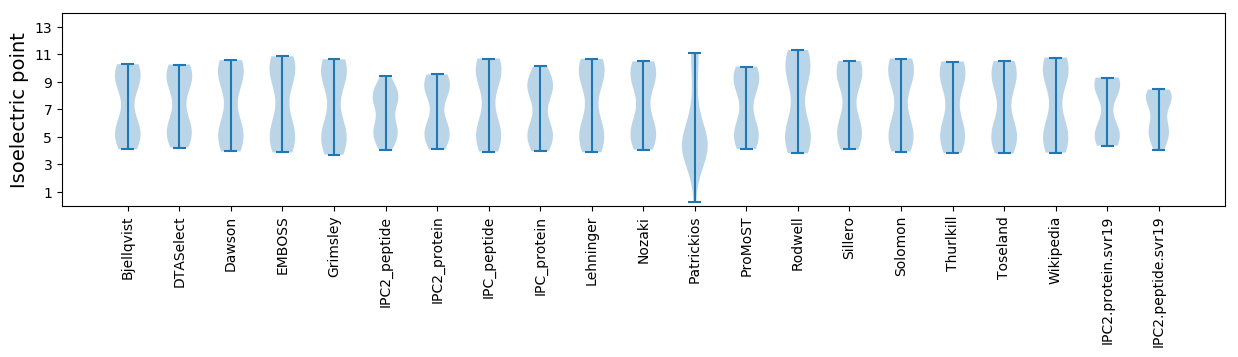
* You can choose from 21 different methods for calculating isoelectric point
Summary statistics related to proteome-wise predictions
Protein with the lowest isoelectric point:
>tr|A0A4D5ZVE4|A0A4D5ZVE4_9VIRU Uncharacterized protein OS=Streptococcus satellite phage Javan734 OX=2558828 GN=JavanS734_0019 PE=4 SV=1
MM1 pKa = 7.22TLDD4 pKa = 4.01LGKK7 pKa = 8.39MTQAEE12 pKa = 4.45FDD14 pKa = 3.72EE15 pKa = 4.66VMADD19 pKa = 3.21IKK21 pKa = 11.13ARR23 pKa = 11.84NPNLLQFITDD33 pKa = 3.81LLDD36 pKa = 3.75RR37 pKa = 11.84KK38 pKa = 8.57VTPEE42 pKa = 4.1EE43 pKa = 4.0VDD45 pKa = 3.88DD46 pKa = 4.43LLNMEE51 pKa = 4.04QAEE54 pKa = 4.0QVEE57 pKa = 4.75YY58 pKa = 10.8IEE60 pKa = 5.26NYY62 pKa = 7.17QAKK65 pKa = 10.08AA66 pKa = 3.19
MM1 pKa = 7.22TLDD4 pKa = 4.01LGKK7 pKa = 8.39MTQAEE12 pKa = 4.45FDD14 pKa = 3.72EE15 pKa = 4.66VMADD19 pKa = 3.21IKK21 pKa = 11.13ARR23 pKa = 11.84NPNLLQFITDD33 pKa = 3.81LLDD36 pKa = 3.75RR37 pKa = 11.84KK38 pKa = 8.57VTPEE42 pKa = 4.1EE43 pKa = 4.0VDD45 pKa = 3.88DD46 pKa = 4.43LLNMEE51 pKa = 4.04QAEE54 pKa = 4.0QVEE57 pKa = 4.75YY58 pKa = 10.8IEE60 pKa = 5.26NYY62 pKa = 7.17QAKK65 pKa = 10.08AA66 pKa = 3.19
Molecular weight: 7.65 kDa
Isoelectric point according different methods:
Protein with the highest isoelectric point:
>tr|A0A4D5ZVD4|A0A4D5ZVD4_9VIRU Glycerate kinase OS=Streptococcus satellite phage Javan734 OX=2558828 GN=JavanS734_0009 PE=4 SV=1
MM1 pKa = 7.53RR2 pKa = 11.84CEE4 pKa = 4.37MMPKK8 pKa = 9.9SNYY11 pKa = 9.57RR12 pKa = 11.84EE13 pKa = 3.74MRR15 pKa = 11.84FISSLGGKK23 pKa = 9.41LLATRR28 pKa = 11.84ILFTVTIANSQQ39 pKa = 3.1
MM1 pKa = 7.53RR2 pKa = 11.84CEE4 pKa = 4.37MMPKK8 pKa = 9.9SNYY11 pKa = 9.57RR12 pKa = 11.84EE13 pKa = 3.74MRR15 pKa = 11.84FISSLGGKK23 pKa = 9.41LLATRR28 pKa = 11.84ILFTVTIANSQQ39 pKa = 3.1
Molecular weight: 4.5 kDa
Isoelectric point according different methods:
Peptides (in silico digests for buttom-up proteomics)
Below you can find in silico digests of the whole proteome with Trypsin, Chymotrypsin, Trypsin+LysC, LysN, ArgC proteases suitable for different mass spec machines.| Try ESI |
 |
|---|
| ChTry ESI |
|
|---|
| ArgC ESI |
|
|---|
| LysN ESI |
|
|---|
| TryLysC ESI |
|
|---|
| Try MALDI |
|
|---|
| ChTry MALDI |
|
|---|
| ArgC MALDI |
|
|---|
| LysN MALDI |
|
|---|
| TryLysC MALDI |
|
|---|
| Try LTQ |
|
|---|
| ChTry LTQ |
|
|---|
| ArgC LTQ |
|
|---|
| LysN LTQ |
|
|---|
| TryLysC LTQ |
|
|---|
| Try MSlow |
|
|---|
| ChTry MSlow |
|
|---|
| ArgC MSlow |
|
|---|
| LysN MSlow |
|
|---|
| TryLysC MSlow |
|
|---|
| Try MShigh |
|
|---|
| ChTry MShigh |
|
|---|
| ArgC MShigh |
|
|---|
| LysN MShigh |
|
|---|
| TryLysC MShigh |
|
|---|
General Statistics
Number of major isoforms |
Number of additional isoforms |
Number of all proteins |
Number of amino acids |
Min. Seq. Length |
Max. Seq. Length |
Avg. Seq. Length |
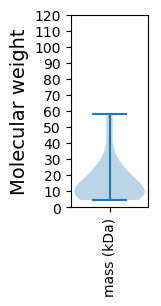
Avg. Mol. Weight |
|---|---|---|---|---|---|---|---|
0 |
3069 |
39 |
507 |
139.5 |
16.15 |
Amino acid frequency
Ala |
Cys |
Asp |
Glu |
Phe |
Gly |
His |
Ile |
Lys |
Leu |
|---|---|---|---|---|---|---|---|---|---|
5.442 ± 0.46 | 0.978 ± 0.209 |
5.409 ± 0.364 | 7.983 ± 0.556 |
4.301 ± 0.54 | 4.725 ± 0.532 |
1.857 ± 0.27 | 7.429 ± 0.423 |
9.677 ± 0.608 | 10.231 ± 0.604 |
Met |
Asn |
Gln |
Pro |
Arg |
Ser |
Thr |
Val |
Trp |
Tyr |
|---|---|---|---|---|---|---|---|---|---|
2.639 ± 0.426 | 5.767 ± 0.405 |
3.128 ± 0.4 | 3.975 ± 0.336 |
4.888 ± 0.383 | 5.539 ± 0.491 |
5.474 ± 0.49 | 5.213 ± 0.399 |
0.912 ± 0.19 | 4.431 ± 0.35 |
Most of the basic statistics you can see at this page can be downloaded from this CSV file
See this proteome in:

Proteome-pI is available under Creative Commons Attribution-NoDerivs license, for more details see here
| Reference: Kozlowski LP. Proteome-pI 2.0: Proteome Isoelectric Point Database Update. Nucleic Acids Res. 2021, doi: 10.1093/nar/gkab944 | Contact: Lukasz P. Kozlowski |