Bacillus phage Silence
Taxonomy: Viruses; Duplodnaviria; Heunggongvirae; Uroviricota; Caudoviricetes; Caudovirales; Siphoviridae; unclassified Siphoviridae
Average proteome isoelectric point is 6.74
Get precalculated fractions of proteins
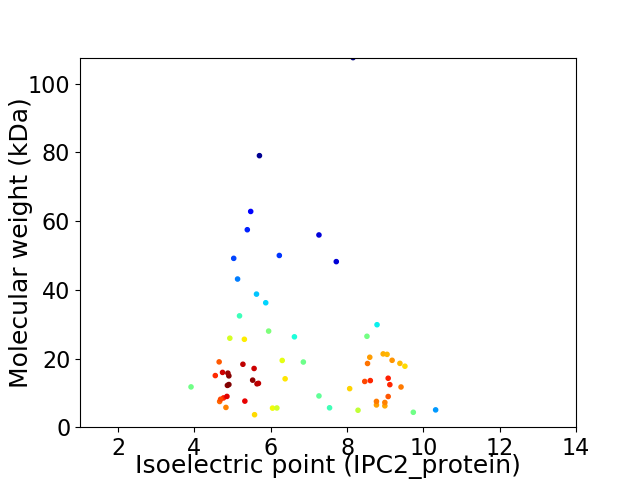
Virtual 2D-PAGE plot for 66 proteins (isoelectric point calculated using IPC2_protein)
Get csv file with sequences according to given criteria:
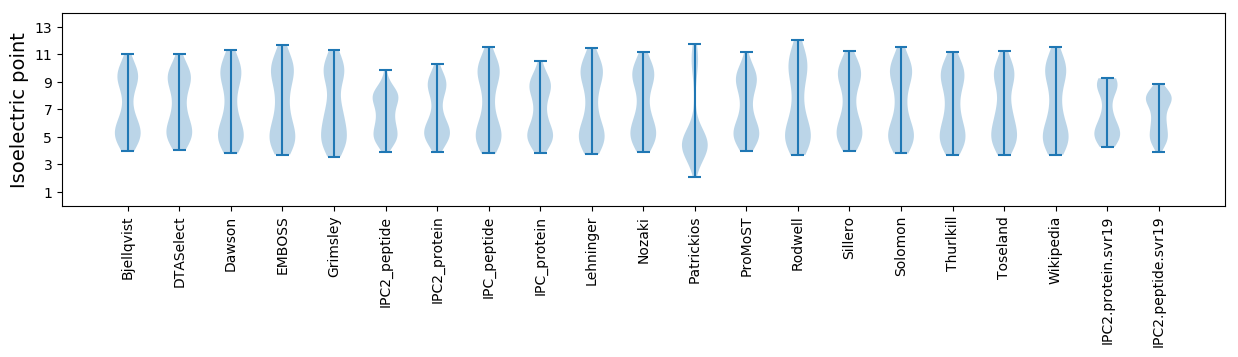
* You can choose from 21 different methods for calculating isoelectric point
Summary statistics related to proteome-wise predictions
Protein with the lowest isoelectric point:
>tr|A0A0K1LMD7|A0A0K1LMD7_9CAUD Endolysin OS=Bacillus phage Silence OX=1675599 GN=CPT_Silence26 PE=4 SV=1
MM1 pKa = 7.14EE2 pKa = 6.23HH3 pKa = 6.93EE4 pKa = 4.39LQDD7 pKa = 3.37IFKK10 pKa = 9.84MYY12 pKa = 10.51IEE14 pKa = 4.48VDD16 pKa = 3.47EE17 pKa = 4.57QGNITDD23 pKa = 4.07SLGGANVVPLKK34 pKa = 10.77DD35 pKa = 3.46YY36 pKa = 10.84TFFFLDD42 pKa = 3.48TAVVEE47 pKa = 4.25GEE49 pKa = 4.18EE50 pKa = 4.3MILPLVMEE58 pKa = 4.65NVFKK62 pKa = 11.13LKK64 pKa = 10.75LVINGFKK71 pKa = 10.65PEE73 pKa = 3.93FVLKK77 pKa = 10.7DD78 pKa = 3.7SNDD81 pKa = 3.49EE82 pKa = 4.18LTLEE86 pKa = 4.2MPGIAVFNDD95 pKa = 3.36DD96 pKa = 3.89PTTGEE101 pKa = 3.99EE102 pKa = 4.44TVV104 pKa = 3.3
MM1 pKa = 7.14EE2 pKa = 6.23HH3 pKa = 6.93EE4 pKa = 4.39LQDD7 pKa = 3.37IFKK10 pKa = 9.84MYY12 pKa = 10.51IEE14 pKa = 4.48VDD16 pKa = 3.47EE17 pKa = 4.57QGNITDD23 pKa = 4.07SLGGANVVPLKK34 pKa = 10.77DD35 pKa = 3.46YY36 pKa = 10.84TFFFLDD42 pKa = 3.48TAVVEE47 pKa = 4.25GEE49 pKa = 4.18EE50 pKa = 4.3MILPLVMEE58 pKa = 4.65NVFKK62 pKa = 11.13LKK64 pKa = 10.75LVINGFKK71 pKa = 10.65PEE73 pKa = 3.93FVLKK77 pKa = 10.7DD78 pKa = 3.7SNDD81 pKa = 3.49EE82 pKa = 4.18LTLEE86 pKa = 4.2MPGIAVFNDD95 pKa = 3.36DD96 pKa = 3.89PTTGEE101 pKa = 3.99EE102 pKa = 4.44TVV104 pKa = 3.3
Molecular weight: 11.73 kDa
Isoelectric point according different methods:
Protein with the highest isoelectric point:
>tr|A0A0K1LLK3|A0A0K1LLK3_9CAUD DNA helicase OS=Bacillus phage Silence OX=1675599 GN=CPT_Silence54 PE=3 SV=1
MM1 pKa = 7.45IRR3 pKa = 11.84ALKK6 pKa = 10.23LAFIAFLSLILWLSIIGWIKK26 pKa = 10.07LIWRR30 pKa = 11.84ALHH33 pKa = 6.42EE34 pKa = 4.53FFF36 pKa = 6.11
MM1 pKa = 7.45IRR3 pKa = 11.84ALKK6 pKa = 10.23LAFIAFLSLILWLSIIGWIKK26 pKa = 10.07LIWRR30 pKa = 11.84ALHH33 pKa = 6.42EE34 pKa = 4.53FFF36 pKa = 6.11
Molecular weight: 4.34 kDa
Isoelectric point according different methods:
Peptides (in silico digests for buttom-up proteomics)
Below you can find in silico digests of the whole proteome with Trypsin, Chymotrypsin, Trypsin+LysC, LysN, ArgC proteases suitable for different mass spec machines.| Try ESI |
 |
|---|
| ChTry ESI |
|
|---|
| ArgC ESI |
|
|---|
| LysN ESI |
|
|---|
| TryLysC ESI |
|
|---|
| Try MALDI |
|
|---|
| ChTry MALDI |
|
|---|
| ArgC MALDI |
|
|---|
| LysN MALDI |
|
|---|
| TryLysC MALDI |
|
|---|
| Try LTQ |
|
|---|
| ChTry LTQ |
|
|---|
| ArgC LTQ |
|
|---|
| LysN LTQ |
|
|---|
| TryLysC LTQ |
|
|---|
| Try MSlow |
|
|---|
| ChTry MSlow |
|
|---|
| ArgC MSlow |
|
|---|
| LysN MSlow |
|
|---|
| TryLysC MSlow |
|
|---|
| Try MShigh |
|
|---|
| ChTry MShigh |
|
|---|
| ArgC MShigh |
|
|---|
| LysN MShigh |
|
|---|
| TryLysC MShigh |
|
|---|
General Statistics
Number of major isoforms |
Number of additional isoforms |
Number of all proteins |
Number of amino acids |
Min. Seq. Length |
Max. Seq. Length |
Avg. Seq. Length |
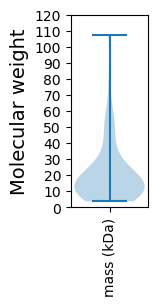
Avg. Mol. Weight |
|---|---|---|---|---|---|---|---|
0 |
12515 |
30 |
1004 |
189.6 |
21.33 |
Amino acid frequency
Ala |
Cys |
Asp |
Glu |
Phe |
Gly |
His |
Ile |
Lys |
Leu |
|---|---|---|---|---|---|---|---|---|---|
7.343 ± 0.659 | 0.871 ± 0.145 |
5.857 ± 0.324 | 6.92 ± 0.496 |
4.187 ± 0.186 | 7.191 ± 0.279 |
1.582 ± 0.124 | 7.127 ± 0.354 |
8.638 ± 0.528 | 8.326 ± 0.287 |
Met |
Asn |
Gln |
Pro |
Arg |
Ser |
Thr |
Val |
Trp |
Tyr |
|---|---|---|---|---|---|---|---|---|---|
3.14 ± 0.322 | 5.753 ± 0.257 |
3.044 ± 0.184 | 3.668 ± 0.352 |
4.251 ± 0.234 | 5.425 ± 0.258 |
5.865 ± 0.283 | 6.177 ± 0.224 |
1.159 ± 0.096 | 3.476 ± 0.244 |
Most of the basic statistics you can see at this page can be downloaded from this CSV file
See this proteome in:

Proteome-pI is available under Creative Commons Attribution-NoDerivs license, for more details see here
| Reference: Kozlowski LP. Proteome-pI 2.0: Proteome Isoelectric Point Database Update. Nucleic Acids Res. 2021, doi: 10.1093/nar/gkab944 | Contact: Lukasz P. Kozlowski |