Podoviridae sp. ctQNx1
Taxonomy: Viruses; Duplodnaviria; Heunggongvirae; Uroviricota; Caudoviricetes; Caudovirales; Podoviridae; unclassified Podoviridae
Average proteome isoelectric point is 6.99
Get precalculated fractions of proteins
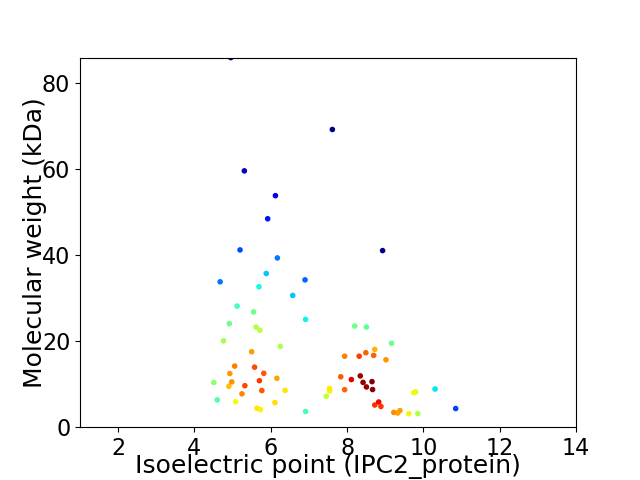
Virtual 2D-PAGE plot for 73 proteins (isoelectric point calculated using IPC2_protein)
Get csv file with sequences according to given criteria:
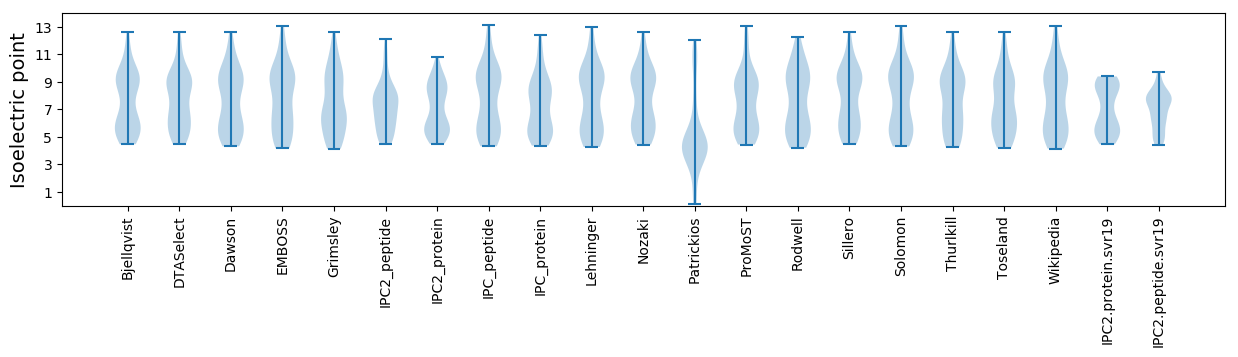
* You can choose from 21 different methods for calculating isoelectric point
Summary statistics related to proteome-wise predictions
Protein with the lowest isoelectric point:
>tr|A0A5Q2W9U1|A0A5Q2W9U1_9CAUD Uncharacterized protein OS=Podoviridae sp. ctQNx1 OX=2656711 PE=4 SV=1
MM1 pKa = 8.13VYY3 pKa = 10.01EE4 pKa = 4.12IDD6 pKa = 3.71GGAVLEE12 pKa = 4.27NEE14 pKa = 4.55EE15 pKa = 4.17YY16 pKa = 10.76TLVGNDD22 pKa = 4.29AEE24 pKa = 4.32NAMDD28 pKa = 4.53DD29 pKa = 4.24RR30 pKa = 11.84LTITHH35 pKa = 7.08KK36 pKa = 10.98ASGDD40 pKa = 3.95SVTLTGLANMTMRR53 pKa = 11.84HH54 pKa = 4.95VLAEE58 pKa = 3.69HH59 pKa = 6.48GMRR62 pKa = 11.84VIDD65 pKa = 5.06LYY67 pKa = 10.73FEE69 pKa = 3.87RR70 pKa = 11.84TAFFTLVNNTPGSTFIPASLSGSAVSS96 pKa = 3.93
MM1 pKa = 8.13VYY3 pKa = 10.01EE4 pKa = 4.12IDD6 pKa = 3.71GGAVLEE12 pKa = 4.27NEE14 pKa = 4.55EE15 pKa = 4.17YY16 pKa = 10.76TLVGNDD22 pKa = 4.29AEE24 pKa = 4.32NAMDD28 pKa = 4.53DD29 pKa = 4.24RR30 pKa = 11.84LTITHH35 pKa = 7.08KK36 pKa = 10.98ASGDD40 pKa = 3.95SVTLTGLANMTMRR53 pKa = 11.84HH54 pKa = 4.95VLAEE58 pKa = 3.69HH59 pKa = 6.48GMRR62 pKa = 11.84VIDD65 pKa = 5.06LYY67 pKa = 10.73FEE69 pKa = 3.87RR70 pKa = 11.84TAFFTLVNNTPGSTFIPASLSGSAVSS96 pKa = 3.93
Molecular weight: 10.37 kDa
Isoelectric point according different methods:
Protein with the highest isoelectric point:
>tr|A0A5Q2W6B1|A0A5Q2W6B1_9CAUD Uncharacterized protein OS=Podoviridae sp. ctQNx1 OX=2656711 PE=4 SV=1
MM1 pKa = 7.41LKK3 pKa = 9.88VRR5 pKa = 11.84IWFRR9 pKa = 11.84VILPATATSRR19 pKa = 11.84GAPRR23 pKa = 11.84SGHH26 pKa = 6.07PGVHH30 pKa = 4.93IVVNARR36 pKa = 11.84VHH38 pKa = 5.63KK39 pKa = 10.7
MM1 pKa = 7.41LKK3 pKa = 9.88VRR5 pKa = 11.84IWFRR9 pKa = 11.84VILPATATSRR19 pKa = 11.84GAPRR23 pKa = 11.84SGHH26 pKa = 6.07PGVHH30 pKa = 4.93IVVNARR36 pKa = 11.84VHH38 pKa = 5.63KK39 pKa = 10.7
Molecular weight: 4.33 kDa
Isoelectric point according different methods:
Peptides (in silico digests for buttom-up proteomics)
Below you can find in silico digests of the whole proteome with Trypsin, Chymotrypsin, Trypsin+LysC, LysN, ArgC proteases suitable for different mass spec machines.| Try ESI |
 |
|---|
| ChTry ESI |
|
|---|
| ArgC ESI |
|
|---|
| LysN ESI |
|
|---|
| TryLysC ESI |
|
|---|
| Try MALDI |
|
|---|
| ChTry MALDI |
|
|---|
| ArgC MALDI |
|
|---|
| LysN MALDI |
|
|---|
| TryLysC MALDI |
|
|---|
| Try LTQ |
|
|---|
| ChTry LTQ |
|
|---|
| ArgC LTQ |
|
|---|
| LysN LTQ |
|
|---|
| TryLysC LTQ |
|
|---|
| Try MSlow |
|
|---|
| ChTry MSlow |
|
|---|
| ArgC MSlow |
|
|---|
| LysN MSlow |
|
|---|
| TryLysC MSlow |
|
|---|
| Try MShigh |
|
|---|
| ChTry MShigh |
|
|---|
| ArgC MShigh |
|
|---|
| LysN MShigh |
|
|---|
| TryLysC MShigh |
|
|---|
General Statistics
Number of major isoforms |
Number of additional isoforms |
Number of all proteins |
Number of amino acids |
Min. Seq. Length |
Max. Seq. Length |
Avg. Seq. Length |
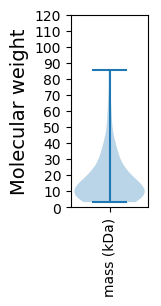
Avg. Mol. Weight |
|---|---|---|---|---|---|---|---|
0 |
11807 |
29 |
752 |
161.7 |
18.04 |
Amino acid frequency
Ala |
Cys |
Asp |
Glu |
Phe |
Gly |
His |
Ile |
Lys |
Leu |
|---|---|---|---|---|---|---|---|---|---|
9.672 ± 0.537 | 1.609 ± 0.215 |
4.853 ± 0.28 | 6.488 ± 0.439 |
3.481 ± 0.242 | 7.275 ± 0.328 |
2.312 ± 0.228 | 5.717 ± 0.178 |
5.471 ± 0.36 | 7.758 ± 0.232 |
Met |
Asn |
Gln |
Pro |
Arg |
Ser |
Thr |
Val |
Trp |
Tyr |
|---|---|---|---|---|---|---|---|---|---|
3.159 ± 0.166 | 4.743 ± 0.279 |
4.226 ± 0.217 | 4.955 ± 0.56 |
5.793 ± 0.295 | 5.742 ± 0.32 |
5.632 ± 0.312 | 6.267 ± 0.414 |
1.448 ± 0.151 | 3.396 ± 0.174 |
Most of the basic statistics you can see at this page can be downloaded from this CSV file
See this proteome in:

Proteome-pI is available under Creative Commons Attribution-NoDerivs license, for more details see here
| Reference: Kozlowski LP. Proteome-pI 2.0: Proteome Isoelectric Point Database Update. Nucleic Acids Res. 2021, doi: 10.1093/nar/gkab944 | Contact: Lukasz P. Kozlowski |