Enterobacteria phage ES18
Taxonomy: Viruses; Duplodnaviria; Heunggongvirae; Uroviricota; Caudoviricetes; Caudovirales; Siphoviridae; unclassified Siphoviridae
Average proteome isoelectric point is 6.96
Get precalculated fractions of proteins
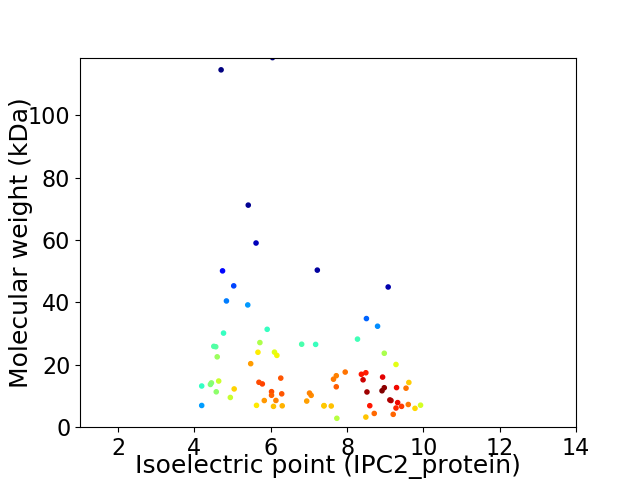
Virtual 2D-PAGE plot for 79 proteins (isoelectric point calculated using IPC2_protein)
Get csv file with sequences according to given criteria:
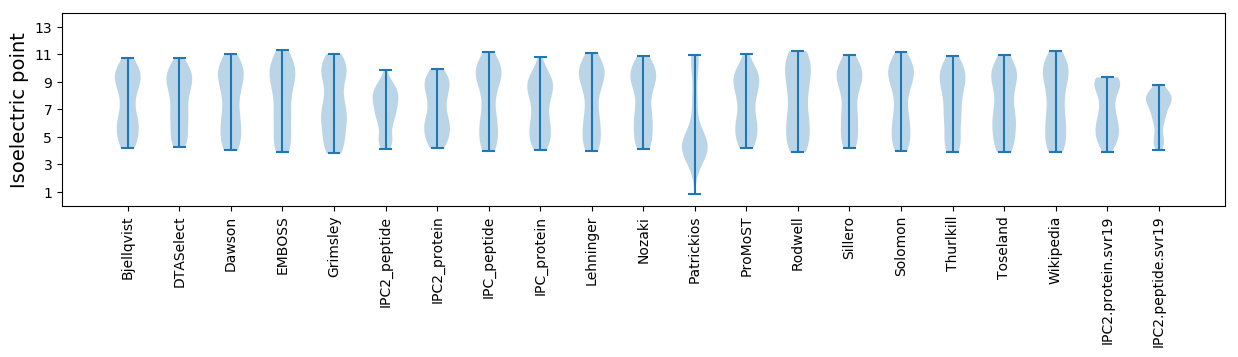
* You can choose from 21 different methods for calculating isoelectric point
Summary statistics related to proteome-wise predictions
Protein with the lowest isoelectric point:
>tr|Q5G8S3|Q5G8S3_9CAUD Protein ninE OS=Enterobacteria phage ES18 OX=101570 GN=66 PE=3 SV=1
MM1 pKa = 7.82IDD3 pKa = 3.4PNRR6 pKa = 11.84SYY8 pKa = 10.45EE9 pKa = 3.94QEE11 pKa = 4.07SIARR15 pKa = 11.84AMCAGCNKK23 pKa = 9.44QLAPDD28 pKa = 4.65EE29 pKa = 4.76IYY31 pKa = 11.21VCAEE35 pKa = 4.43CVNEE39 pKa = 3.68WLVYY43 pKa = 10.01RR44 pKa = 11.84DD45 pKa = 3.46QNGDD49 pKa = 3.11MTEE52 pKa = 4.15EE53 pKa = 4.29DD54 pKa = 4.46DD55 pKa = 4.46EE56 pKa = 5.08RR57 pKa = 11.84CIKK60 pKa = 10.6
MM1 pKa = 7.82IDD3 pKa = 3.4PNRR6 pKa = 11.84SYY8 pKa = 10.45EE9 pKa = 3.94QEE11 pKa = 4.07SIARR15 pKa = 11.84AMCAGCNKK23 pKa = 9.44QLAPDD28 pKa = 4.65EE29 pKa = 4.76IYY31 pKa = 11.21VCAEE35 pKa = 4.43CVNEE39 pKa = 3.68WLVYY43 pKa = 10.01RR44 pKa = 11.84DD45 pKa = 3.46QNGDD49 pKa = 3.11MTEE52 pKa = 4.15EE53 pKa = 4.29DD54 pKa = 4.46DD55 pKa = 4.46EE56 pKa = 5.08RR57 pKa = 11.84CIKK60 pKa = 10.6
Molecular weight: 6.96 kDa
Isoelectric point according different methods:
Protein with the highest isoelectric point:
>tr|Q5G8S4|Q5G8S4_9CAUD Gp65 OS=Enterobacteria phage ES18 OX=101570 GN=65 PE=4 SV=1
MM1 pKa = 7.39ARR3 pKa = 11.84QRR5 pKa = 11.84RR6 pKa = 11.84SITDD10 pKa = 4.1IICEE14 pKa = 3.96NCKK17 pKa = 10.21YY18 pKa = 10.77LPTKK22 pKa = 10.48RR23 pKa = 11.84SRR25 pKa = 11.84NKK27 pKa = 9.52PKK29 pKa = 10.35PIPTEE34 pKa = 4.16SQVKK38 pKa = 8.12TFDD41 pKa = 3.4YY42 pKa = 11.21VYY44 pKa = 11.4GLLQSKK50 pKa = 7.55WNRR53 pKa = 11.84MRR55 pKa = 11.84RR56 pKa = 11.84TRR58 pKa = 3.62
MM1 pKa = 7.39ARR3 pKa = 11.84QRR5 pKa = 11.84RR6 pKa = 11.84SITDD10 pKa = 4.1IICEE14 pKa = 3.96NCKK17 pKa = 10.21YY18 pKa = 10.77LPTKK22 pKa = 10.48RR23 pKa = 11.84SRR25 pKa = 11.84NKK27 pKa = 9.52PKK29 pKa = 10.35PIPTEE34 pKa = 4.16SQVKK38 pKa = 8.12TFDD41 pKa = 3.4YY42 pKa = 11.21VYY44 pKa = 11.4GLLQSKK50 pKa = 7.55WNRR53 pKa = 11.84MRR55 pKa = 11.84RR56 pKa = 11.84TRR58 pKa = 3.62
Molecular weight: 7.06 kDa
Isoelectric point according different methods:
Peptides (in silico digests for buttom-up proteomics)
Below you can find in silico digests of the whole proteome with Trypsin, Chymotrypsin, Trypsin+LysC, LysN, ArgC proteases suitable for different mass spec machines.| Try ESI |
 |
|---|
| ChTry ESI |
|
|---|
| ArgC ESI |
|
|---|
| LysN ESI |
|
|---|
| TryLysC ESI |
|
|---|
| Try MALDI |
|
|---|
| ChTry MALDI |
|
|---|
| ArgC MALDI |
|
|---|
| LysN MALDI |
|
|---|
| TryLysC MALDI |
|
|---|
| Try LTQ |
|
|---|
| ChTry LTQ |
|
|---|
| ArgC LTQ |
|
|---|
| LysN LTQ |
|
|---|
| TryLysC LTQ |
|
|---|
| Try MSlow |
|
|---|
| ChTry MSlow |
|
|---|
| ArgC MSlow |
|
|---|
| LysN MSlow |
|
|---|
| TryLysC MSlow |
|
|---|
| Try MShigh |
|
|---|
| ChTry MShigh |
|
|---|
| ArgC MShigh |
|
|---|
| LysN MShigh |
|
|---|
| TryLysC MShigh |
|
|---|
General Statistics
Number of major isoforms |
Number of additional isoforms |
Number of all proteins |
Number of amino acids |
Min. Seq. Length |
Max. Seq. Length |
Avg. Seq. Length |
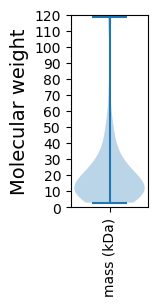
Avg. Mol. Weight |
|---|---|---|---|---|---|---|---|
0 |
14551 |
26 |
1124 |
184.2 |
20.56 |
Amino acid frequency
Ala |
Cys |
Asp |
Glu |
Phe |
Gly |
His |
Ile |
Lys |
Leu |
|---|---|---|---|---|---|---|---|---|---|
9.882 ± 0.719 | 1.354 ± 0.187 |
5.505 ± 0.208 | 6.982 ± 0.398 |
3.12 ± 0.15 | 6.742 ± 0.333 |
1.697 ± 0.172 | 5.842 ± 0.155 |
6.529 ± 0.375 | 7.58 ± 0.349 |
Met |
Asn |
Gln |
Pro |
Arg |
Ser |
Thr |
Val |
Trp |
Tyr |
|---|---|---|---|---|---|---|---|---|---|
2.653 ± 0.128 | 4.927 ± 0.174 |
3.649 ± 0.266 | 4.46 ± 0.353 |
5.848 ± 0.281 | 6.405 ± 0.222 |
5.759 ± 0.408 | 6.116 ± 0.233 |
1.697 ± 0.175 | 3.251 ± 0.187 |
Most of the basic statistics you can see at this page can be downloaded from this CSV file
See this proteome in:

Proteome-pI is available under Creative Commons Attribution-NoDerivs license, for more details see here
| Reference: Kozlowski LP. Proteome-pI 2.0: Proteome Isoelectric Point Database Update. Nucleic Acids Res. 2021, doi: 10.1093/nar/gkab944 | Contact: Lukasz P. Kozlowski |