Staphylococcus virus 96
Taxonomy: Viruses; Duplodnaviria; Heunggongvirae; Uroviricota; Caudoviricetes; Caudovirales; Siphoviridae; Azeredovirinae; Phietavirus
Average proteome isoelectric point is 6.59
Get precalculated fractions of proteins
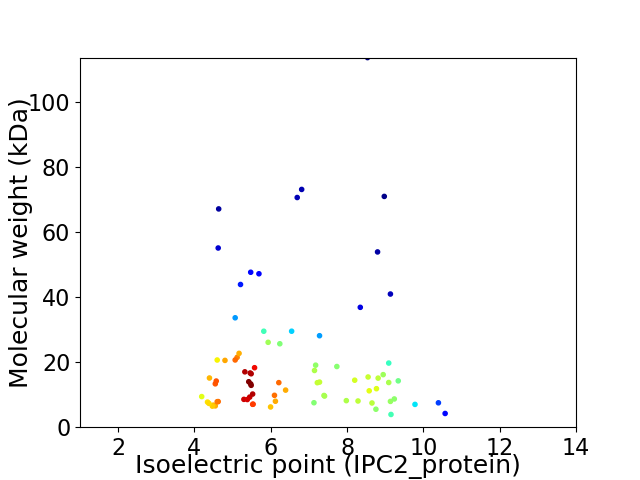
Virtual 2D-PAGE plot for 79 proteins (isoelectric point calculated using IPC2_protein)
Get csv file with sequences according to given criteria:
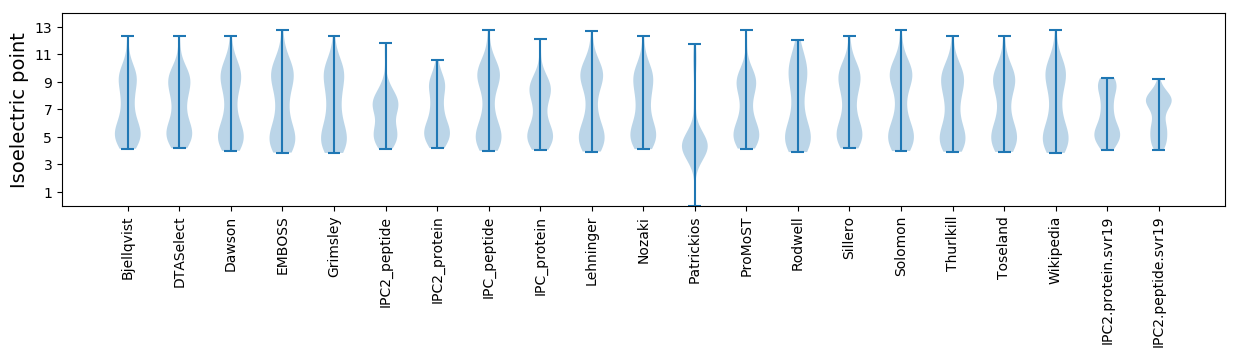
* You can choose from 21 different methods for calculating isoelectric point
Summary statistics related to proteome-wise predictions
Protein with the lowest isoelectric point:
>tr|Q4ZBT9|Q4ZBT9_9CAUD ORF060 OS=Staphylococcus virus 96 OX=320842 PE=4 SV=1
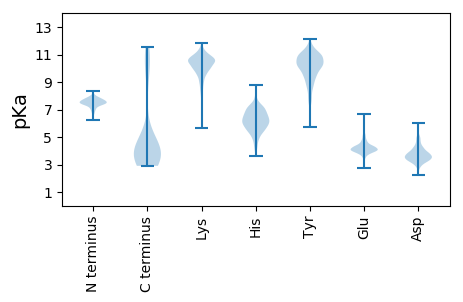
MM1 pKa = 7.45ATQKK5 pKa = 10.54QVDD8 pKa = 4.13YY9 pKa = 11.64VMSLQEE15 pKa = 3.89QLGLEE20 pKa = 4.28DD21 pKa = 3.85CEE23 pKa = 5.23KK24 pKa = 10.6YY25 pKa = 9.42TDD27 pKa = 3.83EE28 pKa = 4.01QVKK31 pKa = 10.4AMSHH35 pKa = 6.03KK36 pKa = 10.06EE37 pKa = 3.72VSNVIEE43 pKa = 4.26NYY45 pKa = 7.91KK46 pKa = 9.56TSIWDD51 pKa = 3.31EE52 pKa = 3.94EE53 pKa = 4.79LYY55 pKa = 10.65NEE57 pKa = 4.54CMSFGLPNCC66 pKa = 4.51
MM1 pKa = 7.45ATQKK5 pKa = 10.54QVDD8 pKa = 4.13YY9 pKa = 11.64VMSLQEE15 pKa = 3.89QLGLEE20 pKa = 4.28DD21 pKa = 3.85CEE23 pKa = 5.23KK24 pKa = 10.6YY25 pKa = 9.42TDD27 pKa = 3.83EE28 pKa = 4.01QVKK31 pKa = 10.4AMSHH35 pKa = 6.03KK36 pKa = 10.06EE37 pKa = 3.72VSNVIEE43 pKa = 4.26NYY45 pKa = 7.91KK46 pKa = 9.56TSIWDD51 pKa = 3.31EE52 pKa = 3.94EE53 pKa = 4.79LYY55 pKa = 10.65NEE57 pKa = 4.54CMSFGLPNCC66 pKa = 4.51
Molecular weight: 7.72 kDa
Isoelectric point according different methods:
Protein with the highest isoelectric point:
>tr|Q4ZBS7|Q4ZBS7_9CAUD ORF024 OS=Staphylococcus virus 96 OX=320842 PE=4 SV=1
MM1 pKa = 7.63NILLLLEE8 pKa = 4.68IIRR11 pKa = 11.84RR12 pKa = 11.84LQLLRR17 pKa = 11.84RR18 pKa = 11.84RR19 pKa = 11.84VKK21 pKa = 10.55KK22 pKa = 9.47EE23 pKa = 3.69RR24 pKa = 11.84KK25 pKa = 8.83RR26 pKa = 11.84STRR29 pKa = 11.84NKK31 pKa = 10.21LRR33 pKa = 3.66
MM1 pKa = 7.63NILLLLEE8 pKa = 4.68IIRR11 pKa = 11.84RR12 pKa = 11.84LQLLRR17 pKa = 11.84RR18 pKa = 11.84RR19 pKa = 11.84VKK21 pKa = 10.55KK22 pKa = 9.47EE23 pKa = 3.69RR24 pKa = 11.84KK25 pKa = 8.83RR26 pKa = 11.84STRR29 pKa = 11.84NKK31 pKa = 10.21LRR33 pKa = 3.66
Molecular weight: 4.21 kDa
Isoelectric point according different methods:
Peptides (in silico digests for buttom-up proteomics)
Below you can find in silico digests of the whole proteome with Trypsin, Chymotrypsin, Trypsin+LysC, LysN, ArgC proteases suitable for different mass spec machines.| Try ESI |
 |
|---|
| ChTry ESI |
|
|---|
| ArgC ESI |
|
|---|
| LysN ESI |
|
|---|
| TryLysC ESI |
|
|---|
| Try MALDI |
|
|---|
| ChTry MALDI |
|
|---|
| ArgC MALDI |
|
|---|
| LysN MALDI |
|
|---|
| TryLysC MALDI |
|
|---|
| Try LTQ |
|
|---|
| ChTry LTQ |
|
|---|
| ArgC LTQ |
|
|---|
| LysN LTQ |
|
|---|
| TryLysC LTQ |
|
|---|
| Try MSlow |
|
|---|
| ChTry MSlow |
|
|---|
| ArgC MSlow |
|
|---|
| LysN MSlow |
|
|---|
| TryLysC MSlow |
|
|---|
| Try MShigh |
|
|---|
| ChTry MShigh |
|
|---|
| ArgC MShigh |
|
|---|
| LysN MShigh |
|
|---|
| TryLysC MShigh |
|
|---|
General Statistics
Number of major isoforms |
Number of additional isoforms |
Number of all proteins |
Number of amino acids |
Min. Seq. Length |
Max. Seq. Length |
Avg. Seq. Length |
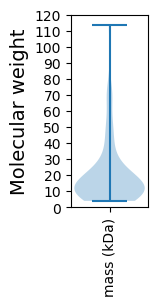
Avg. Mol. Weight |
|---|---|---|---|---|---|---|---|
0 |
14130 |
33 |
1047 |
178.9 |
20.49 |
Amino acid frequency
Ala |
Cys |
Asp |
Glu |
Phe |
Gly |
His |
Ile |
Lys |
Leu |
|---|---|---|---|---|---|---|---|---|---|
5.633 ± 0.341 | 0.538 ± 0.091 |
6.277 ± 0.316 | 7.403 ± 0.443 |
4.381 ± 0.255 | 5.598 ± 0.334 |
1.72 ± 0.165 | 7.488 ± 0.239 |
9.179 ± 0.337 | 7.615 ± 0.28 |
Met |
Asn |
Gln |
Pro |
Arg |
Ser |
Thr |
Val |
Trp |
Tyr |
|---|---|---|---|---|---|---|---|---|---|
2.682 ± 0.21 | 6.525 ± 0.292 |
2.923 ± 0.224 | 4.14 ± 0.199 |
4.055 ± 0.224 | 6.03 ± 0.275 |
6.065 ± 0.266 | 6.249 ± 0.308 |
1.139 ± 0.152 | 4.36 ± 0.355 |
Most of the basic statistics you can see at this page can be downloaded from this CSV file
See this proteome in:

Proteome-pI is available under Creative Commons Attribution-NoDerivs license, for more details see here
| Reference: Kozlowski LP. Proteome-pI 2.0: Proteome Isoelectric Point Database Update. Nucleic Acids Res. 2021, doi: 10.1093/nar/gkab944 | Contact: Lukasz P. Kozlowski |