Williamsia sp. Leaf354
Taxonomy: cellular organisms; Bacteria; Terrabacteria group; Actinobacteria; Actinomycetia; Corynebacteriales; Nocardiaceae; Williamsia; unclassified Williamsia
Average proteome isoelectric point is 6.0
Get precalculated fractions of proteins
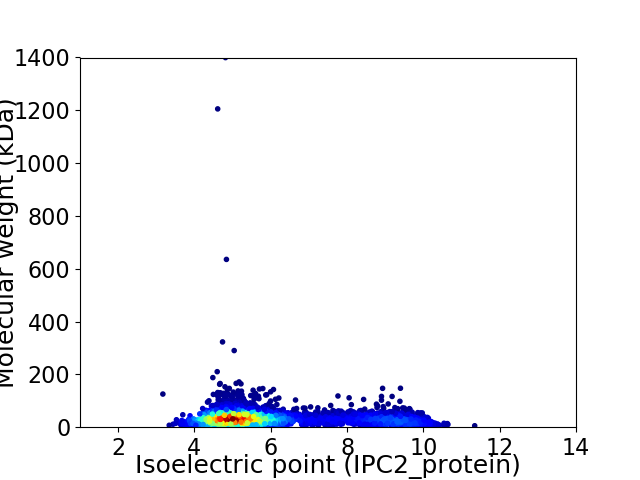
Virtual 2D-PAGE plot for 4063 proteins (isoelectric point calculated using IPC2_protein)
Get csv file with sequences according to given criteria:
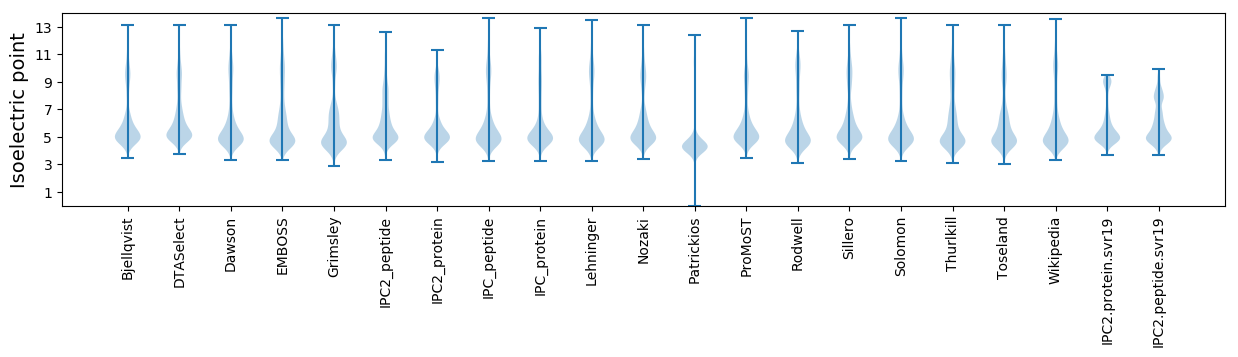
* You can choose from 21 different methods for calculating isoelectric point
Summary statistics related to proteome-wise predictions
Protein with the lowest isoelectric point:
>tr|A0A0Q5QLJ4|A0A0Q5QLJ4_9NOCA Peptide-binding protein OS=Williamsia sp. Leaf354 OX=1736349 GN=ASG12_08420 PE=4 SV=1
MM1 pKa = 7.68ICPIDD6 pKa = 4.17GDD8 pKa = 3.95NCTFDD13 pKa = 4.79ADD15 pKa = 3.65KK16 pKa = 11.37CPFDD20 pKa = 4.72GDD22 pKa = 3.93KK23 pKa = 11.33CPMDD27 pKa = 4.27GDD29 pKa = 4.2KK30 pKa = 11.35CPMDD34 pKa = 4.27GDD36 pKa = 4.2KK37 pKa = 11.35CPMDD41 pKa = 4.19GDD43 pKa = 3.87KK44 pKa = 11.39CPFDD48 pKa = 4.52GDD50 pKa = 3.46KK51 pKa = 11.26CPIDD55 pKa = 3.85GASISDD61 pKa = 3.48
MM1 pKa = 7.68ICPIDD6 pKa = 4.17GDD8 pKa = 3.95NCTFDD13 pKa = 4.79ADD15 pKa = 3.65KK16 pKa = 11.37CPFDD20 pKa = 4.72GDD22 pKa = 3.93KK23 pKa = 11.33CPMDD27 pKa = 4.27GDD29 pKa = 4.2KK30 pKa = 11.35CPMDD34 pKa = 4.27GDD36 pKa = 4.2KK37 pKa = 11.35CPMDD41 pKa = 4.19GDD43 pKa = 3.87KK44 pKa = 11.39CPFDD48 pKa = 4.52GDD50 pKa = 3.46KK51 pKa = 11.26CPIDD55 pKa = 3.85GASISDD61 pKa = 3.48
Molecular weight: 6.48 kDa
Isoelectric point according different methods:
Protein with the highest isoelectric point:
>tr|A0A0Q5QQF7|A0A0Q5QQF7_9NOCA TetR family transcriptional regulator OS=Williamsia sp. Leaf354 OX=1736349 GN=ASG12_18070 PE=4 SV=1
MM1 pKa = 7.69AKK3 pKa = 10.06GKK5 pKa = 8.69RR6 pKa = 11.84TFQPNNRR13 pKa = 11.84RR14 pKa = 11.84RR15 pKa = 11.84ARR17 pKa = 11.84VHH19 pKa = 5.99GFRR22 pKa = 11.84LRR24 pKa = 11.84MRR26 pKa = 11.84TRR28 pKa = 11.84AGRR31 pKa = 11.84AIVNGRR37 pKa = 11.84RR38 pKa = 11.84RR39 pKa = 11.84KK40 pKa = 9.79GRR42 pKa = 11.84AGLTAA47 pKa = 4.67
MM1 pKa = 7.69AKK3 pKa = 10.06GKK5 pKa = 8.69RR6 pKa = 11.84TFQPNNRR13 pKa = 11.84RR14 pKa = 11.84RR15 pKa = 11.84ARR17 pKa = 11.84VHH19 pKa = 5.99GFRR22 pKa = 11.84LRR24 pKa = 11.84MRR26 pKa = 11.84TRR28 pKa = 11.84AGRR31 pKa = 11.84AIVNGRR37 pKa = 11.84RR38 pKa = 11.84RR39 pKa = 11.84KK40 pKa = 9.79GRR42 pKa = 11.84AGLTAA47 pKa = 4.67
Molecular weight: 5.46 kDa
Isoelectric point according different methods:
Peptides (in silico digests for buttom-up proteomics)
Below you can find in silico digests of the whole proteome with Trypsin, Chymotrypsin, Trypsin+LysC, LysN, ArgC proteases suitable for different mass spec machines.| Try ESI |
 |
|---|
| ChTry ESI |
|
|---|
| ArgC ESI |
|
|---|
| LysN ESI |
|
|---|
| TryLysC ESI |
|
|---|
| Try MALDI |
|
|---|
| ChTry MALDI |
|
|---|
| ArgC MALDI |
|
|---|
| LysN MALDI |
|
|---|
| TryLysC MALDI |
|
|---|
| Try LTQ |
|
|---|
| ChTry LTQ |
|
|---|
| ArgC LTQ |
|
|---|
| LysN LTQ |
|
|---|
| TryLysC LTQ |
|
|---|
| Try MSlow |
|
|---|
| ChTry MSlow |
|
|---|
| ArgC MSlow |
|
|---|
| LysN MSlow |
|
|---|
| TryLysC MSlow |
|
|---|
| Try MShigh |
|
|---|
| ChTry MShigh |
|
|---|
| ArgC MShigh |
|
|---|
| LysN MShigh |
|
|---|
| TryLysC MShigh |
|
|---|
General Statistics
Number of major isoforms |
Number of additional isoforms |
Number of all proteins |
Number of amino acids |
Min. Seq. Length |
Max. Seq. Length |
Avg. Seq. Length |
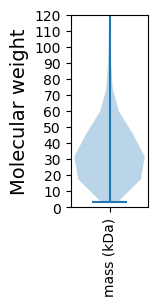
Avg. Mol. Weight |
|---|---|---|---|---|---|---|---|
0 |
1352199 |
32 |
13274 |
332.8 |
35.47 |
Amino acid frequency
Ala |
Cys |
Asp |
Glu |
Phe |
Gly |
His |
Ile |
Lys |
Leu |
|---|---|---|---|---|---|---|---|---|---|
13.201 ± 0.058 | 0.713 ± 0.013 |
6.935 ± 0.048 | 4.808 ± 0.035 |
2.938 ± 0.022 | 9.085 ± 0.055 |
2.195 ± 0.02 | 4.459 ± 0.03 |
1.854 ± 0.036 | 9.341 ± 0.043 |
Met |
Asn |
Gln |
Pro |
Arg |
Ser |
Thr |
Val |
Trp |
Tyr |
|---|---|---|---|---|---|---|---|---|---|
1.976 ± 0.017 | 1.931 ± 0.028 |
5.529 ± 0.034 | 2.5 ± 0.022 |
7.439 ± 0.044 | 5.86 ± 0.03 |
6.728 ± 0.031 | 9.232 ± 0.047 |
1.382 ± 0.015 | 1.895 ± 0.019 |
Most of the basic statistics you can see at this page can be downloaded from this CSV file
See this proteome in:

Proteome-pI is available under Creative Commons Attribution-NoDerivs license, for more details see here
| Reference: Kozlowski LP. Proteome-pI 2.0: Proteome Isoelectric Point Database Update. Nucleic Acids Res. 2021, doi: 10.1093/nar/gkab944 | Contact: Lukasz P. Kozlowski |