Lates calcarifer (Barramundi) (Holocentrus calcarifer)
Taxonomy: cellular organisms; Eukaryota; Opisthokonta; Metazoa; Eumetazoa; Bilateria; Deuterostomia; Chordata; Craniata; Vertebrata; Gnathostomata; Teleostomi; Euteleostomi; Actinopterygii; Actinopteri; Neopterygii; Teleostei; Osteoglossocephalai; Clupeocephala; Euteleosteomorpha; Neoteleostei;
Average proteome isoelectric point is 6.46
Get precalculated fractions of proteins
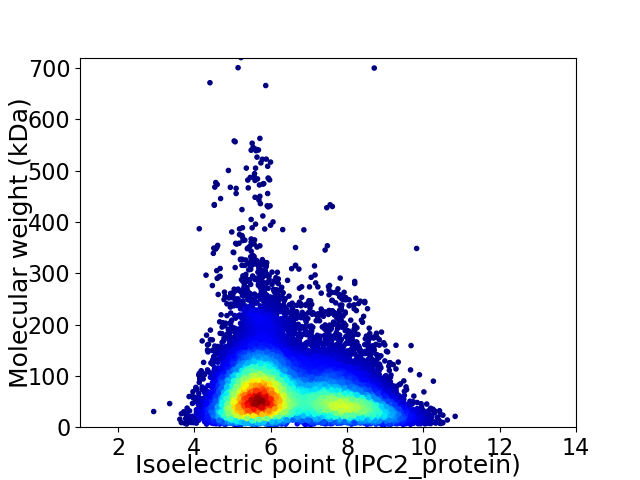
Virtual 2D-PAGE plot for 57547 proteins (isoelectric point calculated using IPC2_protein)
Get csv file with sequences according to given criteria:
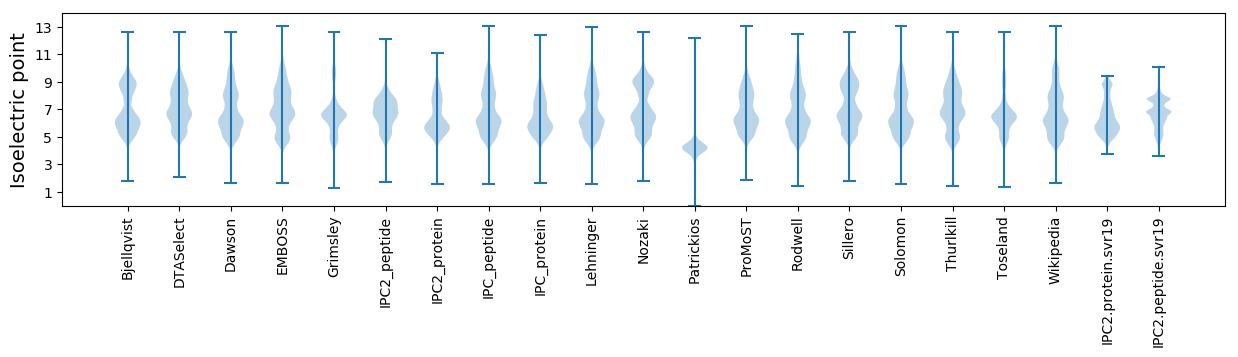
* You can choose from 21 different methods for calculating isoelectric point
Summary statistics related to proteome-wise predictions
Protein with the lowest isoelectric point:
>tr|A0A4W6FBF1|A0A4W6FBF1_LATCA Mitochondrial ribosomal protein L38 OS=Lates calcarifer OX=8187 GN=mrpl38 PE=4 SV=1
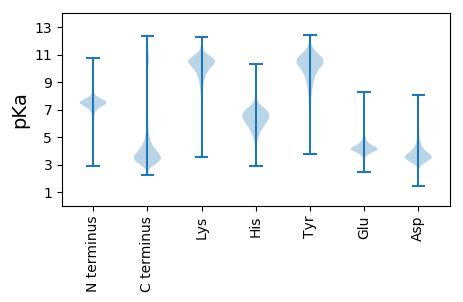
MM1 pKa = 7.71LSTPSILDD9 pKa = 3.72HH10 pKa = 7.06PPSPMDD16 pKa = 3.37TSDD19 pKa = 4.61LGFSPHH25 pKa = 5.39STALDD30 pKa = 3.93FGDD33 pKa = 3.89PTLDD37 pKa = 3.58SMDD40 pKa = 3.5WLDD43 pKa = 3.34ISMVGIGGTSLAPLAPHH60 pKa = 6.82TPPSVFSADD69 pKa = 3.8FLDD72 pKa = 4.3STDD75 pKa = 4.75LQLHH79 pKa = 6.06WEE81 pKa = 4.25SCLL84 pKa = 3.68
MM1 pKa = 7.71LSTPSILDD9 pKa = 3.72HH10 pKa = 7.06PPSPMDD16 pKa = 3.37TSDD19 pKa = 4.61LGFSPHH25 pKa = 5.39STALDD30 pKa = 3.93FGDD33 pKa = 3.89PTLDD37 pKa = 3.58SMDD40 pKa = 3.5WLDD43 pKa = 3.34ISMVGIGGTSLAPLAPHH60 pKa = 6.82TPPSVFSADD69 pKa = 3.8FLDD72 pKa = 4.3STDD75 pKa = 4.75LQLHH79 pKa = 6.06WEE81 pKa = 4.25SCLL84 pKa = 3.68
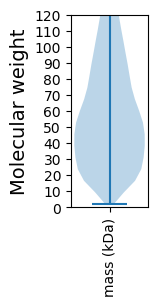
Molecular weight: 8.95 kDa
Isoelectric point according different methods:
Protein with the highest isoelectric point:
>tr|A0A4W6E993|A0A4W6E993_LATCA Uncharacterized protein OS=Lates calcarifer OX=8187 PE=3 SV=1
SS1 pKa = 4.63SHH3 pKa = 5.15KK4 pKa = 8.9TFRR7 pKa = 11.84IKK9 pKa = 10.64RR10 pKa = 11.84FLAKK14 pKa = 9.71KK15 pKa = 9.58QKK17 pKa = 8.69QNRR20 pKa = 11.84PIPQWIRR27 pKa = 11.84MKK29 pKa = 9.89TGNKK33 pKa = 8.61IRR35 pKa = 11.84YY36 pKa = 7.09NSKK39 pKa = 8.3RR40 pKa = 11.84RR41 pKa = 11.84HH42 pKa = 3.95WRR44 pKa = 11.84RR45 pKa = 11.84TKK47 pKa = 10.83LGLL50 pKa = 3.67
SS1 pKa = 4.63SHH3 pKa = 5.15KK4 pKa = 8.9TFRR7 pKa = 11.84IKK9 pKa = 10.64RR10 pKa = 11.84FLAKK14 pKa = 9.71KK15 pKa = 9.58QKK17 pKa = 8.69QNRR20 pKa = 11.84PIPQWIRR27 pKa = 11.84MKK29 pKa = 9.89TGNKK33 pKa = 8.61IRR35 pKa = 11.84YY36 pKa = 7.09NSKK39 pKa = 8.3RR40 pKa = 11.84RR41 pKa = 11.84HH42 pKa = 3.95WRR44 pKa = 11.84RR45 pKa = 11.84TKK47 pKa = 10.83LGLL50 pKa = 3.67
Molecular weight: 6.28 kDa
Isoelectric point according different methods:
Peptides (in silico digests for buttom-up proteomics)
Below you can find in silico digests of the whole proteome with Trypsin, Chymotrypsin, Trypsin+LysC, LysN, ArgC proteases suitable for different mass spec machines.| Try ESI |
 |
|---|
| ChTry ESI |
|
|---|
| ArgC ESI |
|
|---|
| LysN ESI |
|
|---|
| TryLysC ESI |
|
|---|
| Try MALDI |
|
|---|
| ChTry MALDI |
|
|---|
| ArgC MALDI |
|
|---|
| LysN MALDI |
|
|---|
| TryLysC MALDI |
|
|---|
| Try LTQ |
|
|---|
| ChTry LTQ |
|
|---|
| ArgC LTQ |
|
|---|
| LysN LTQ |
|
|---|
| TryLysC LTQ |
|
|---|
| Try MSlow |
|
|---|
| ChTry MSlow |
|
|---|
| ArgC MSlow |
|
|---|
| LysN MSlow |
|
|---|
| TryLysC MSlow |
|
|---|
| Try MShigh |
|
|---|
| ChTry MShigh |
|
|---|
| ArgC MShigh |
|
|---|
| LysN MShigh |
|
|---|
| TryLysC MShigh |
|
|---|
General Statistics
Number of major isoforms |
Number of additional isoforms |
Number of all proteins |
Number of amino acids |
Min. Seq. Length |
Max. Seq. Length |
Avg. Seq. Length |
Avg. Mol. Weight |
|---|---|---|---|---|---|---|---|
37319313 |
17 |
6353 |
648.5 |
72.62 |
Amino acid frequency
Ala |
Cys |
Asp |
Glu |
Phe |
Gly |
His |
Ile |
Lys |
Leu |
|---|---|---|---|---|---|---|---|---|---|
6.441 ± 0.008 | 2.283 ± 0.008 |
5.242 ± 0.006 | 6.787 ± 0.011 |
3.815 ± 0.007 | 6.254 ± 0.011 |
2.631 ± 0.004 | 4.705 ± 0.007 |
5.635 ± 0.01 | 9.717 ± 0.011 |
Met |
Asn |
Gln |
Pro |
Arg |
Ser |
Thr |
Val |
Trp |
Tyr |
|---|---|---|---|---|---|---|---|---|---|
2.432 ± 0.005 | 3.929 ± 0.006 |
5.395 ± 0.01 | 4.664 ± 0.008 |
5.536 ± 0.007 | 8.248 ± 0.011 |
5.667 ± 0.008 | 6.501 ± 0.007 |
1.193 ± 0.003 | 2.926 ± 0.005 |
Most of the basic statistics you can see at this page can be downloaded from this CSV file
See this proteome in:

Proteome-pI is available under Creative Commons Attribution-NoDerivs license, for more details see here
| Reference: Kozlowski LP. Proteome-pI 2.0: Proteome Isoelectric Point Database Update. Nucleic Acids Res. 2021, doi: 10.1093/nar/gkab944 | Contact: Lukasz P. Kozlowski |