Fimbriimonas ginsengisoli Gsoil 348
Taxonomy: cellular organisms; Bacteria; Terrabacteria group; Armatimonadetes; Fimbriimonadia; Fimbriimonadales; Fimbriimonadaceae; Fimbriimonas; Fimbriimonas ginsengisoli
Average proteome isoelectric point is 6.57
Get precalculated fractions of proteins
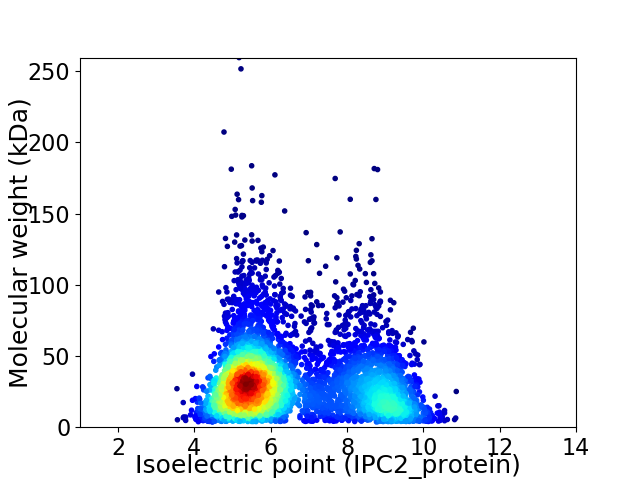
Virtual 2D-PAGE plot for 4817 proteins (isoelectric point calculated using IPC2_protein)
Get csv file with sequences according to given criteria:
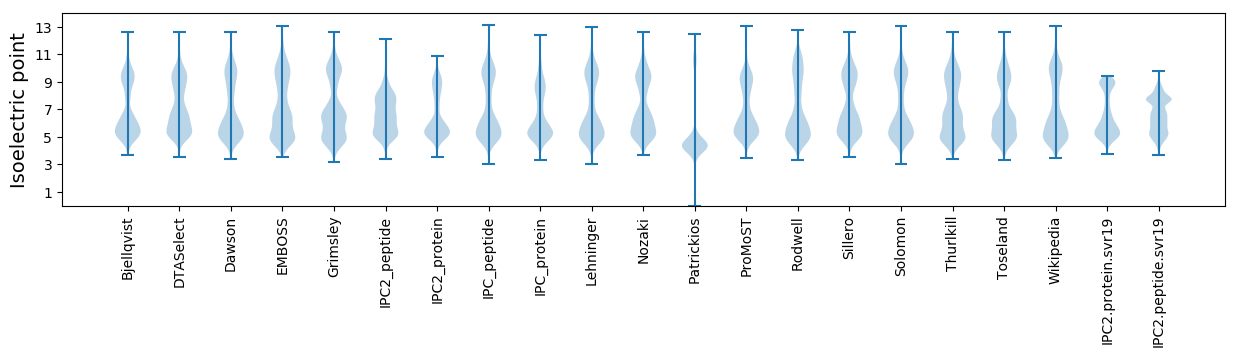
* You can choose from 21 different methods for calculating isoelectric point
Summary statistics related to proteome-wise predictions
Protein with the lowest isoelectric point:
>tr|A0A068NQ48|A0A068NQ48_9BACT Uncharacterized protein OS=Fimbriimonas ginsengisoli Gsoil 348 OX=661478 GN=OP10G_2310 PE=4 SV=1
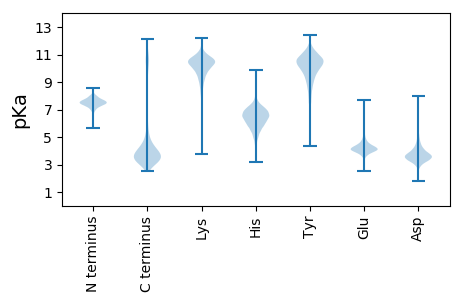
MM1 pKa = 7.64FSTLIDD7 pKa = 3.78GAEE10 pKa = 4.24FACGLQLQTGLDD22 pKa = 3.79EE23 pKa = 5.3PDD25 pKa = 4.25DD26 pKa = 5.2GIVCAEE32 pKa = 4.08VVSACEE38 pKa = 4.16SMDD41 pKa = 3.84FRR43 pKa = 11.84LDD45 pKa = 3.39VQGDD49 pKa = 3.86IEE51 pKa = 4.67SHH53 pKa = 6.4CNRR56 pKa = 11.84SPQPFF61 pKa = 3.33
MM1 pKa = 7.64FSTLIDD7 pKa = 3.78GAEE10 pKa = 4.24FACGLQLQTGLDD22 pKa = 3.79EE23 pKa = 5.3PDD25 pKa = 4.25DD26 pKa = 5.2GIVCAEE32 pKa = 4.08VVSACEE38 pKa = 4.16SMDD41 pKa = 3.84FRR43 pKa = 11.84LDD45 pKa = 3.39VQGDD49 pKa = 3.86IEE51 pKa = 4.67SHH53 pKa = 6.4CNRR56 pKa = 11.84SPQPFF61 pKa = 3.33
Molecular weight: 6.61 kDa
Isoelectric point according different methods:
Protein with the highest isoelectric point:
>tr|A0A068NP97|A0A068NP97_9BACT Alpha/beta fold superfamily hydrolase OS=Fimbriimonas ginsengisoli Gsoil 348 OX=661478 GN=OP10G_1903 PE=4 SV=1
MM1 pKa = 7.57GSKK4 pKa = 10.21KK5 pKa = 10.32LPRR8 pKa = 11.84INHH11 pKa = 5.35GMRR14 pKa = 11.84AGLVALLIALPLLALGASMASHH36 pKa = 7.64PASGHH41 pKa = 4.37GTAPGALAAMAFGAVSMFGRR61 pKa = 11.84RR62 pKa = 11.84RR63 pKa = 11.84TT64 pKa = 3.53
MM1 pKa = 7.57GSKK4 pKa = 10.21KK5 pKa = 10.32LPRR8 pKa = 11.84INHH11 pKa = 5.35GMRR14 pKa = 11.84AGLVALLIALPLLALGASMASHH36 pKa = 7.64PASGHH41 pKa = 4.37GTAPGALAAMAFGAVSMFGRR61 pKa = 11.84RR62 pKa = 11.84RR63 pKa = 11.84TT64 pKa = 3.53
Molecular weight: 6.44 kDa
Isoelectric point according different methods:
Peptides (in silico digests for buttom-up proteomics)
Below you can find in silico digests of the whole proteome with Trypsin, Chymotrypsin, Trypsin+LysC, LysN, ArgC proteases suitable for different mass spec machines.| Try ESI |
 |
|---|
| ChTry ESI |
|
|---|
| ArgC ESI |
|
|---|
| LysN ESI |
|
|---|
| TryLysC ESI |
|
|---|
| Try MALDI |
|
|---|
| ChTry MALDI |
|
|---|
| ArgC MALDI |
|
|---|
| LysN MALDI |
|
|---|
| TryLysC MALDI |
|
|---|
| Try LTQ |
|
|---|
| ChTry LTQ |
|
|---|
| ArgC LTQ |
|
|---|
| LysN LTQ |
|
|---|
| TryLysC LTQ |
|
|---|
| Try MSlow |
|
|---|
| ChTry MSlow |
|
|---|
| ArgC MSlow |
|
|---|
| LysN MSlow |
|
|---|
| TryLysC MSlow |
|
|---|
| Try MShigh |
|
|---|
| ChTry MShigh |
|
|---|
| ArgC MShigh |
|
|---|
| LysN MShigh |
|
|---|
| TryLysC MShigh |
|
|---|
General Statistics
Number of major isoforms |
Number of additional isoforms |
Number of all proteins |
Number of amino acids |
Min. Seq. Length |
Max. Seq. Length |
Avg. Seq. Length |
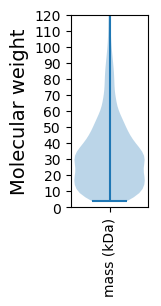
Avg. Mol. Weight |
|---|---|---|---|---|---|---|---|
0 |
1529550 |
37 |
2429 |
317.5 |
34.79 |
Amino acid frequency
Ala |
Cys |
Asp |
Glu |
Phe |
Gly |
His |
Ile |
Lys |
Leu |
|---|---|---|---|---|---|---|---|---|---|
10.357 ± 0.043 | 0.863 ± 0.01 |
5.592 ± 0.025 | 5.947 ± 0.04 |
3.83 ± 0.022 | 8.585 ± 0.031 |
2.062 ± 0.016 | 4.821 ± 0.022 |
3.9 ± 0.029 | 9.619 ± 0.039 |
Met |
Asn |
Gln |
Pro |
Arg |
Ser |
Thr |
Val |
Trp |
Tyr |
|---|---|---|---|---|---|---|---|---|---|
2.339 ± 0.018 | 3.044 ± 0.023 |
5.522 ± 0.026 | 3.241 ± 0.019 |
6.817 ± 0.039 | 6.013 ± 0.033 |
5.65 ± 0.042 | 7.514 ± 0.033 |
1.566 ± 0.018 | 2.717 ± 0.016 |
Most of the basic statistics you can see at this page can be downloaded from this CSV file
See this proteome in:

Proteome-pI is available under Creative Commons Attribution-NoDerivs license, for more details see here
| Reference: Kozlowski LP. Proteome-pI 2.0: Proteome Isoelectric Point Database Update. Nucleic Acids Res. 2021, doi: 10.1093/nar/gkab944 | Contact: Lukasz P. Kozlowski |