Sulfuracidifex tepidarius
Taxonomy: cellular organisms; Archaea; TACK group; Crenarchaeota; Thermoprotei; Sulfolobales; Sulfolobaceae; Sulfuracidifex
Average proteome isoelectric point is 6.81
Get precalculated fractions of proteins
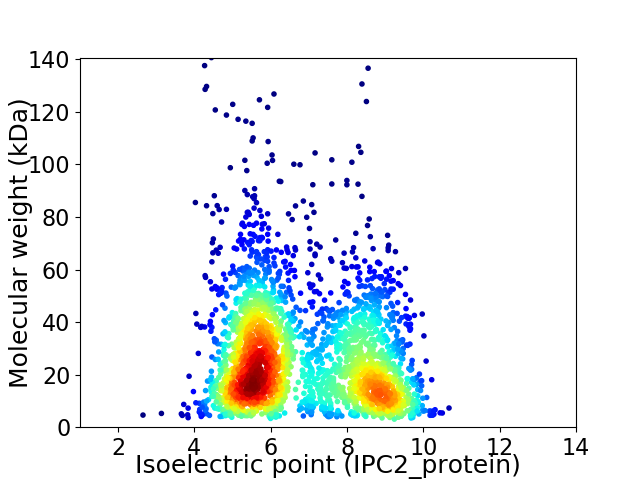
Virtual 2D-PAGE plot for 2770 proteins (isoelectric point calculated using IPC2_protein)
Get csv file with sequences according to given criteria:
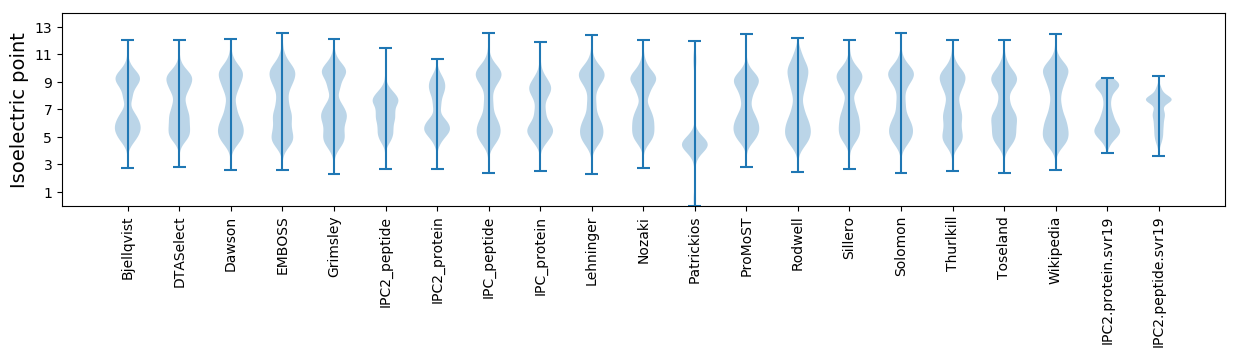
* You can choose from 21 different methods for calculating isoelectric point
Summary statistics related to proteome-wise predictions
Protein with the lowest isoelectric point:
>tr|A0A510E186|A0A510E186_9CREN Uncharacterized protein OS=Sulfuracidifex tepidarius OX=1294262 GN=IC006_0739 PE=4 SV=1
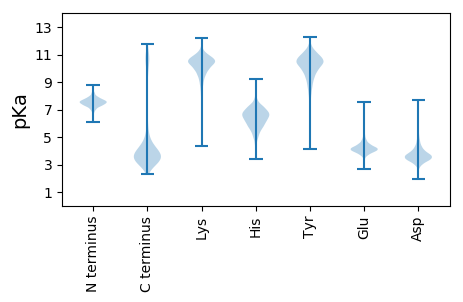
MM1 pKa = 7.37MGLNTYY7 pKa = 7.84TDD9 pKa = 4.15PYY11 pKa = 10.49EE12 pKa = 4.58GNLDD16 pKa = 3.43VGLGYY21 pKa = 7.96TQNGRR26 pKa = 11.84AFIVLTEE33 pKa = 3.96GLPNDD38 pKa = 4.67SITAFNVLKK47 pKa = 10.45VIEE50 pKa = 4.29MNAA53 pKa = 3.01
MM1 pKa = 7.37MGLNTYY7 pKa = 7.84TDD9 pKa = 4.15PYY11 pKa = 10.49EE12 pKa = 4.58GNLDD16 pKa = 3.43VGLGYY21 pKa = 7.96TQNGRR26 pKa = 11.84AFIVLTEE33 pKa = 3.96GLPNDD38 pKa = 4.67SITAFNVLKK47 pKa = 10.45VIEE50 pKa = 4.29MNAA53 pKa = 3.01
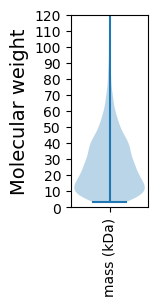
Molecular weight: 5.78 kDa
Isoelectric point according different methods:
Protein with the highest isoelectric point:
>tr|A0A510DX84|A0A510DX84_9CREN Putative respiratory nitrate reductase subunit cytochrome b-561 OS=Sulfuracidifex tepidarius OX=1294262 GN=IC006_2151 PE=4 SV=1
MM1 pKa = 6.97VRR3 pKa = 11.84DD4 pKa = 3.7YY5 pKa = 11.46EE6 pKa = 4.22RR7 pKa = 11.84VEE9 pKa = 4.1GLTLSKK15 pKa = 10.59PRR17 pKa = 11.84GEE19 pKa = 3.88KK20 pKa = 9.54RR21 pKa = 11.84RR22 pKa = 11.84GRR24 pKa = 11.84EE25 pKa = 3.22EE26 pKa = 4.0YY27 pKa = 9.8IRR29 pKa = 11.84KK30 pKa = 9.35KK31 pKa = 10.58RR32 pKa = 11.84ISNVSNNN39 pKa = 3.21
MM1 pKa = 6.97VRR3 pKa = 11.84DD4 pKa = 3.7YY5 pKa = 11.46EE6 pKa = 4.22RR7 pKa = 11.84VEE9 pKa = 4.1GLTLSKK15 pKa = 10.59PRR17 pKa = 11.84GEE19 pKa = 3.88KK20 pKa = 9.54RR21 pKa = 11.84RR22 pKa = 11.84GRR24 pKa = 11.84EE25 pKa = 3.22EE26 pKa = 4.0YY27 pKa = 9.8IRR29 pKa = 11.84KK30 pKa = 9.35KK31 pKa = 10.58RR32 pKa = 11.84ISNVSNNN39 pKa = 3.21
Molecular weight: 4.72 kDa
Isoelectric point according different methods:
Peptides (in silico digests for buttom-up proteomics)
Below you can find in silico digests of the whole proteome with Trypsin, Chymotrypsin, Trypsin+LysC, LysN, ArgC proteases suitable for different mass spec machines.| Try ESI |
 |
|---|
| ChTry ESI |
|
|---|
| ArgC ESI |
|
|---|
| LysN ESI |
|
|---|
| TryLysC ESI |
|
|---|
| Try MALDI |
|
|---|
| ChTry MALDI |
|
|---|
| ArgC MALDI |
|
|---|
| LysN MALDI |
|
|---|
| TryLysC MALDI |
|
|---|
| Try LTQ |
|
|---|
| ChTry LTQ |
|
|---|
| ArgC LTQ |
|
|---|
| LysN LTQ |
|
|---|
| TryLysC LTQ |
|
|---|
| Try MSlow |
|
|---|
| ChTry MSlow |
|
|---|
| ArgC MSlow |
|
|---|
| LysN MSlow |
|
|---|
| TryLysC MSlow |
|
|---|
| Try MShigh |
|
|---|
| ChTry MShigh |
|
|---|
| ArgC MShigh |
|
|---|
| LysN MShigh |
|
|---|
| TryLysC MShigh |
|
|---|
General Statistics
Number of major isoforms |
Number of additional isoforms |
Number of all proteins |
Number of amino acids |
Min. Seq. Length |
Max. Seq. Length |
Avg. Seq. Length |
Avg. Mol. Weight |
|---|---|---|---|---|---|---|---|
0 |
702152 |
30 |
1291 |
253.5 |
28.43 |
Amino acid frequency
Ala |
Cys |
Asp |
Glu |
Phe |
Gly |
His |
Ile |
Lys |
Leu |
|---|---|---|---|---|---|---|---|---|---|
5.67 ± 0.042 | 0.679 ± 0.017 |
4.901 ± 0.039 | 6.828 ± 0.061 |
4.684 ± 0.04 | 7.053 ± 0.048 |
1.406 ± 0.018 | 7.675 ± 0.054 |
7.001 ± 0.065 | 9.872 ± 0.059 |
Met |
Asn |
Gln |
Pro |
Arg |
Ser |
Thr |
Val |
Trp |
Tyr |
|---|---|---|---|---|---|---|---|---|---|
2.814 ± 0.021 | 4.252 ± 0.038 |
4.029 ± 0.033 | 2.155 ± 0.027 |
4.635 ± 0.047 | 7.895 ± 0.055 |
4.897 ± 0.037 | 8.417 ± 0.045 |
0.982 ± 0.015 | 4.157 ± 0.04 |
Most of the basic statistics you can see at this page can be downloaded from this CSV file
See this proteome in:

Proteome-pI is available under Creative Commons Attribution-NoDerivs license, for more details see here
| Reference: Kozlowski LP. Proteome-pI 2.0: Proteome Isoelectric Point Database Update. Nucleic Acids Res. 2021, doi: 10.1093/nar/gkab944 | Contact: Lukasz P. Kozlowski |