Staphylococcus virus 53
Taxonomy: Viruses; Duplodnaviria; Heunggongvirae; Uroviricota; Caudoviricetes; Caudovirales; Siphoviridae; Azeredovirinae; Dubowvirus
Average proteome isoelectric point is 6.68
Get precalculated fractions of proteins
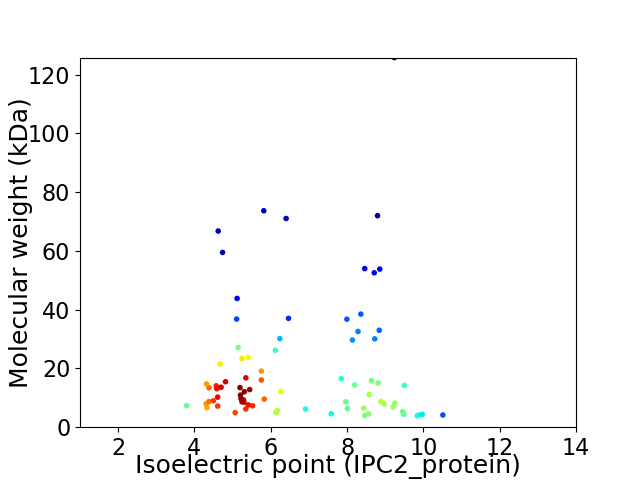
Virtual 2D-PAGE plot for 79 proteins (isoelectric point calculated using IPC2_protein)
Get csv file with sequences according to given criteria:
* You can choose from 21 different methods for calculating isoelectric point
Summary statistics related to proteome-wise predictions

Protein with the lowest isoelectric point:
>tr|Q4ZDH3|Q4ZDH3_9CAUD ORF033 OS=Staphylococcus virus 53 OX=320835 PE=4 SV=1
MM1 pKa = 6.89QQQAYY6 pKa = 9.38INATIDD12 pKa = 2.95IRR14 pKa = 11.84IPTEE18 pKa = 3.49VEE20 pKa = 3.58YY21 pKa = 10.91QYY23 pKa = 11.49FDD25 pKa = 3.82DD26 pKa = 5.0VDD28 pKa = 3.64IEE30 pKa = 4.33KK31 pKa = 10.59EE32 pKa = 3.88ALADD36 pKa = 3.61YY37 pKa = 10.58LYY39 pKa = 11.17NNPDD43 pKa = 3.26EE44 pKa = 4.53LLEE47 pKa = 3.95YY48 pKa = 11.05DD49 pKa = 3.49NLKK52 pKa = 9.69IRR54 pKa = 11.84NVNVEE59 pKa = 3.93VEE61 pKa = 4.1
MM1 pKa = 6.89QQQAYY6 pKa = 9.38INATIDD12 pKa = 2.95IRR14 pKa = 11.84IPTEE18 pKa = 3.49VEE20 pKa = 3.58YY21 pKa = 10.91QYY23 pKa = 11.49FDD25 pKa = 3.82DD26 pKa = 5.0VDD28 pKa = 3.64IEE30 pKa = 4.33KK31 pKa = 10.59EE32 pKa = 3.88ALADD36 pKa = 3.61YY37 pKa = 10.58LYY39 pKa = 11.17NNPDD43 pKa = 3.26EE44 pKa = 4.53LLEE47 pKa = 3.95YY48 pKa = 11.05DD49 pKa = 3.49NLKK52 pKa = 9.69IRR54 pKa = 11.84NVNVEE59 pKa = 3.93VEE61 pKa = 4.1
Molecular weight: 7.3 kDa
Isoelectric point according different methods:
Protein with the highest isoelectric point:
>tr|Q4ZDI6|Q4ZDI6_9CAUD ORF083 OS=Staphylococcus virus 53 OX=320835 PE=4 SV=1
MM1 pKa = 7.2NVAILANPAIDD12 pKa = 3.52HH13 pKa = 6.54AVVKK17 pKa = 9.77YY18 pKa = 10.59RR19 pKa = 11.84NGISTIAKK27 pKa = 6.5TVKK30 pKa = 10.34HH31 pKa = 5.08NTANRR36 pKa = 3.55
MM1 pKa = 7.2NVAILANPAIDD12 pKa = 3.52HH13 pKa = 6.54AVVKK17 pKa = 9.77YY18 pKa = 10.59RR19 pKa = 11.84NGISTIAKK27 pKa = 6.5TVKK30 pKa = 10.34HH31 pKa = 5.08NTANRR36 pKa = 3.55
Molecular weight: 3.9 kDa
Isoelectric point according different methods:
Peptides (in silico digests for buttom-up proteomics)
Below you can find in silico digests of the whole proteome with Trypsin, Chymotrypsin, Trypsin+LysC, LysN, ArgC proteases suitable for different mass spec machines.| Try ESI |
 |
|---|
| ChTry ESI |
|
|---|
| ArgC ESI |
|
|---|
| LysN ESI |
|
|---|
| TryLysC ESI |
|
|---|
| Try MALDI |
|
|---|
| ChTry MALDI |
|
|---|
| ArgC MALDI |
|
|---|
| LysN MALDI |
|
|---|
| TryLysC MALDI |
|
|---|
| Try LTQ |
|
|---|
| ChTry LTQ |
|
|---|
| ArgC LTQ |
|
|---|
| LysN LTQ |
|
|---|
| TryLysC LTQ |
|
|---|
| Try MSlow |
|
|---|
| ChTry MSlow |
|
|---|
| ArgC MSlow |
|
|---|
| LysN MSlow |
|
|---|
| TryLysC MSlow |
|
|---|
| Try MShigh |
|
|---|
| ChTry MShigh |
|
|---|
| ArgC MShigh |
|
|---|
| LysN MShigh |
|
|---|
| TryLysC MShigh |
|
|---|
General Statistics
Number of major isoforms |
Number of additional isoforms |
Number of all proteins |
Number of amino acids |
Min. Seq. Length |
Max. Seq. Length |
Avg. Seq. Length |
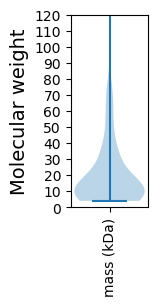
Avg. Mol. Weight |
|---|---|---|---|---|---|---|---|
0 |
14140 |
33 |
1154 |
179.0 |
20.53 |
Amino acid frequency
Ala |
Cys |
Asp |
Glu |
Phe |
Gly |
His |
Ile |
Lys |
Leu |
|---|---|---|---|---|---|---|---|---|---|
5.58 ± 0.482 | 0.608 ± 0.097 |
6.174 ± 0.372 | 7.412 ± 0.504 |
4.335 ± 0.2 | 5.41 ± 0.315 |
1.627 ± 0.15 | 7.631 ± 0.29 |
9.47 ± 0.37 | 7.694 ± 0.287 |
Met |
Asn |
Gln |
Pro |
Arg |
Ser |
Thr |
Val |
Trp |
Tyr |
|---|---|---|---|---|---|---|---|---|---|
2.631 ± 0.154 | 6.924 ± 0.245 |
2.786 ± 0.205 | 3.741 ± 0.173 |
4.052 ± 0.246 | 5.764 ± 0.249 |
6.252 ± 0.307 | 6.28 ± 0.31 |
1.075 ± 0.186 | 4.554 ± 0.364 |
Most of the basic statistics you can see at this page can be downloaded from this CSV file
See this proteome in:

Proteome-pI is available under Creative Commons Attribution-NoDerivs license, for more details see here
| Reference: Kozlowski LP. Proteome-pI 2.0: Proteome Isoelectric Point Database Update. Nucleic Acids Res. 2021, doi: 10.1093/nar/gkab944 | Contact: Lukasz P. Kozlowski |