Hydrogenophaga sp. PBC
Taxonomy: cellular organisms; Bacteria; Proteobacteria; Betaproteobacteria; Burkholderiales; Comamonadaceae; Hydrogenophaga; unclassified Hydrogenophaga
Average proteome isoelectric point is 6.93
Get precalculated fractions of proteins
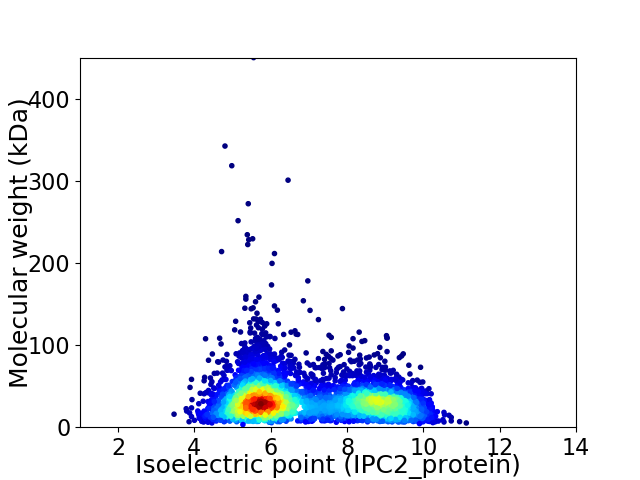
Virtual 2D-PAGE plot for 4855 proteins (isoelectric point calculated using IPC2_protein)
Get csv file with sequences according to given criteria:
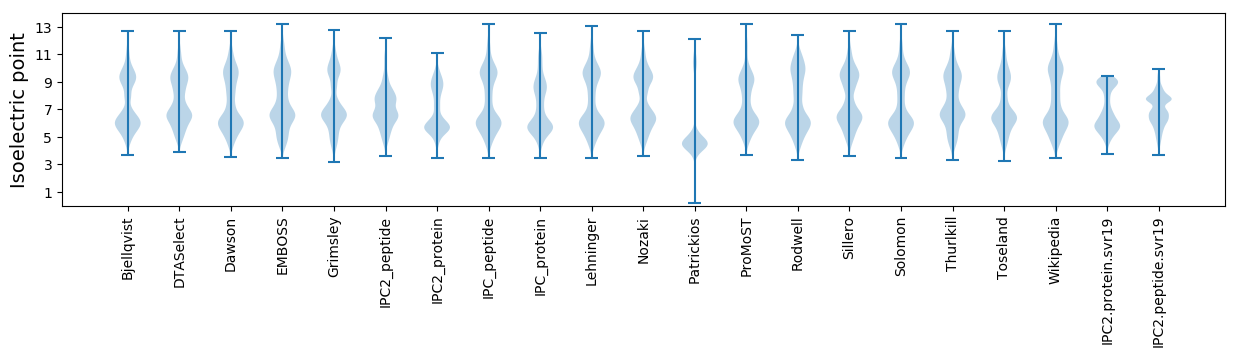
* You can choose from 21 different methods for calculating isoelectric point
Summary statistics related to proteome-wise predictions
Protein with the lowest isoelectric point:
>tr|A0A1C9VGZ9|A0A1C9VGZ9_9BURK Acetyltransferase OS=Hydrogenophaga sp. PBC OX=795665 GN=Q5W_14075 PE=4 SV=1
MM1 pKa = 8.19DD2 pKa = 4.81EE3 pKa = 5.13PDD5 pKa = 3.62LFTWLQHH12 pKa = 4.61WRR14 pKa = 11.84CNTGHH19 pKa = 6.8EE20 pKa = 4.16AQAAQAMPQVEE31 pKa = 4.36PLALQVGDD39 pKa = 3.26AWMALSTTQQPDD51 pKa = 3.69VIRR54 pKa = 11.84VDD56 pKa = 3.71VLIEE60 pKa = 3.74PVLEE64 pKa = 4.39HH65 pKa = 6.96EE66 pKa = 4.46VAPWICEE73 pKa = 3.69EE74 pKa = 4.02LLRR77 pKa = 11.84WSFGHH82 pKa = 7.23PYY84 pKa = 10.62LSDD87 pKa = 3.51GLQFALDD94 pKa = 3.69PDD96 pKa = 4.4GALVACAQLAIEE108 pKa = 5.05PGMEE112 pKa = 3.88APAVEE117 pKa = 4.4EE118 pKa = 4.23LLMEE122 pKa = 4.17TAEE125 pKa = 4.49QINEE129 pKa = 3.52AWTLIMADD137 pKa = 4.44ALLQAYY143 pKa = 7.92LAQQPPTAVQGSLAVV158 pKa = 3.44
MM1 pKa = 8.19DD2 pKa = 4.81EE3 pKa = 5.13PDD5 pKa = 3.62LFTWLQHH12 pKa = 4.61WRR14 pKa = 11.84CNTGHH19 pKa = 6.8EE20 pKa = 4.16AQAAQAMPQVEE31 pKa = 4.36PLALQVGDD39 pKa = 3.26AWMALSTTQQPDD51 pKa = 3.69VIRR54 pKa = 11.84VDD56 pKa = 3.71VLIEE60 pKa = 3.74PVLEE64 pKa = 4.39HH65 pKa = 6.96EE66 pKa = 4.46VAPWICEE73 pKa = 3.69EE74 pKa = 4.02LLRR77 pKa = 11.84WSFGHH82 pKa = 7.23PYY84 pKa = 10.62LSDD87 pKa = 3.51GLQFALDD94 pKa = 3.69PDD96 pKa = 4.4GALVACAQLAIEE108 pKa = 5.05PGMEE112 pKa = 3.88APAVEE117 pKa = 4.4EE118 pKa = 4.23LLMEE122 pKa = 4.17TAEE125 pKa = 4.49QINEE129 pKa = 3.52AWTLIMADD137 pKa = 4.44ALLQAYY143 pKa = 7.92LAQQPPTAVQGSLAVV158 pKa = 3.44
Molecular weight: 17.41 kDa
Isoelectric point according different methods:
Protein with the highest isoelectric point:
>tr|A0A1C9VKA5|A0A1C9VKA5_9BURK Lipoprotein signal peptidase OS=Hydrogenophaga sp. PBC OX=795665 GN=lspA PE=3 SV=1
MM1 pKa = 7.92IGISPRR7 pKa = 11.84ALISSMAALLALLLSRR23 pKa = 11.84VTFSGTPLAFMALSKK38 pKa = 10.74KK39 pKa = 8.71RR40 pKa = 11.84TAAALSRR47 pKa = 11.84WAVSRR52 pKa = 11.84KK53 pKa = 8.05STVFPSLSTARR64 pKa = 3.86
MM1 pKa = 7.92IGISPRR7 pKa = 11.84ALISSMAALLALLLSRR23 pKa = 11.84VTFSGTPLAFMALSKK38 pKa = 10.74KK39 pKa = 8.71RR40 pKa = 11.84TAAALSRR47 pKa = 11.84WAVSRR52 pKa = 11.84KK53 pKa = 8.05STVFPSLSTARR64 pKa = 3.86
Molecular weight: 6.78 kDa
Isoelectric point according different methods:
Peptides (in silico digests for buttom-up proteomics)
Below you can find in silico digests of the whole proteome with Trypsin, Chymotrypsin, Trypsin+LysC, LysN, ArgC proteases suitable for different mass spec machines.| Try ESI |
 |
|---|
| ChTry ESI |
|
|---|
| ArgC ESI |
|
|---|
| LysN ESI |
|
|---|
| TryLysC ESI |
|
|---|
| Try MALDI |
|
|---|
| ChTry MALDI |
|
|---|
| ArgC MALDI |
|
|---|
| LysN MALDI |
|
|---|
| TryLysC MALDI |
|
|---|
| Try LTQ |
|
|---|
| ChTry LTQ |
|
|---|
| ArgC LTQ |
|
|---|
| LysN LTQ |
|
|---|
| TryLysC LTQ |
|
|---|
| Try MSlow |
|
|---|
| ChTry MSlow |
|
|---|
| ArgC MSlow |
|
|---|
| LysN MSlow |
|
|---|
| TryLysC MSlow |
|
|---|
| Try MShigh |
|
|---|
| ChTry MShigh |
|
|---|
| ArgC MShigh |
|
|---|
| LysN MShigh |
|
|---|
| TryLysC MShigh |
|
|---|
General Statistics
Number of major isoforms |
Number of additional isoforms |
Number of all proteins |
Number of amino acids |
Min. Seq. Length |
Max. Seq. Length |
Avg. Seq. Length |
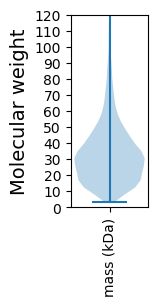
Avg. Mol. Weight |
|---|---|---|---|---|---|---|---|
0 |
1570076 |
27 |
4199 |
323.4 |
35.08 |
Amino acid frequency
Ala |
Cys |
Asp |
Glu |
Phe |
Gly |
His |
Ile |
Lys |
Leu |
|---|---|---|---|---|---|---|---|---|---|
13.168 ± 0.05 | 0.863 ± 0.009 |
5.298 ± 0.024 | 5.34 ± 0.03 |
3.395 ± 0.018 | 8.489 ± 0.031 |
2.387 ± 0.019 | 3.994 ± 0.024 |
2.869 ± 0.036 | 11.05 ± 0.047 |
Met |
Asn |
Gln |
Pro |
Arg |
Ser |
Thr |
Val |
Trp |
Tyr |
|---|---|---|---|---|---|---|---|---|---|
2.378 ± 0.018 | 2.434 ± 0.022 |
5.509 ± 0.027 | 3.982 ± 0.023 |
7.454 ± 0.035 | 5.013 ± 0.024 |
5.061 ± 0.024 | 7.711 ± 0.027 |
1.59 ± 0.017 | 2.017 ± 0.015 |
Most of the basic statistics you can see at this page can be downloaded from this CSV file
See this proteome in:

Proteome-pI is available under Creative Commons Attribution-NoDerivs license, for more details see here
| Reference: Kozlowski LP. Proteome-pI 2.0: Proteome Isoelectric Point Database Update. Nucleic Acids Res. 2021, doi: 10.1093/nar/gkab944 | Contact: Lukasz P. Kozlowski |