Lactobacillus virus phiJL1
Taxonomy: Viruses; Duplodnaviria; Heunggongvirae; Uroviricota; Caudoviricetes; Caudovirales; Siphoviridae; Coetzeevirus
Average proteome isoelectric point is 6.24
Get precalculated fractions of proteins
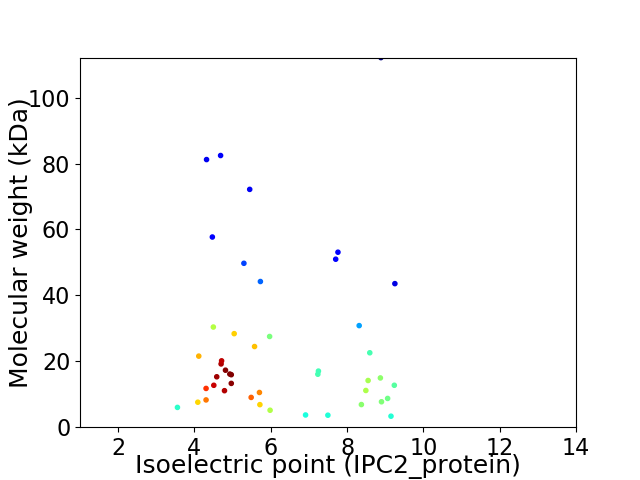
Virtual 2D-PAGE plot for 46 proteins (isoelectric point calculated using IPC2_protein)
Get csv file with sequences according to given criteria:
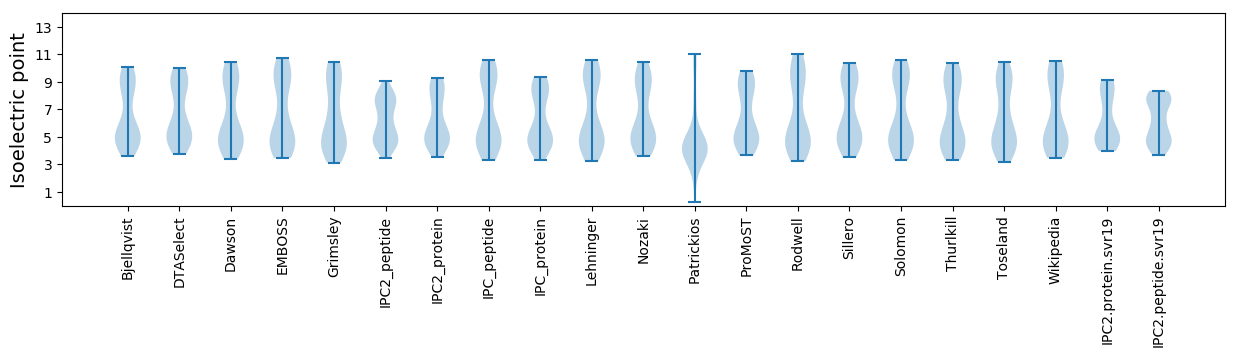
* You can choose from 21 different methods for calculating isoelectric point
Summary statistics related to proteome-wise predictions
Protein with the lowest isoelectric point:
>tr|Q597W9|Q597W9_9CAUD Putative HNH homing endonuclease OS=Lactobacillus virus phiJL1 OX=235201 PE=4 SV=1
MM1 pKa = 7.58SEE3 pKa = 3.8LTIEE7 pKa = 4.13EE8 pKa = 4.34RR9 pKa = 11.84EE10 pKa = 4.01LLKK13 pKa = 10.52WVLQEE18 pKa = 4.27VNSQNSVQPLEE29 pKa = 4.33SLADD33 pKa = 3.51VCEE36 pKa = 4.91SIDD39 pKa = 5.19LGNAPAGLEE48 pKa = 3.78RR49 pKa = 11.84PYY51 pKa = 11.24YY52 pKa = 9.69GMSYY56 pKa = 9.79KK57 pKa = 10.39HH58 pKa = 5.88QLIFLTEE65 pKa = 3.95YY66 pKa = 10.72IMALEE71 pKa = 4.19EE72 pKa = 4.02
MM1 pKa = 7.58SEE3 pKa = 3.8LTIEE7 pKa = 4.13EE8 pKa = 4.34RR9 pKa = 11.84EE10 pKa = 4.01LLKK13 pKa = 10.52WVLQEE18 pKa = 4.27VNSQNSVQPLEE29 pKa = 4.33SLADD33 pKa = 3.51VCEE36 pKa = 4.91SIDD39 pKa = 5.19LGNAPAGLEE48 pKa = 3.78RR49 pKa = 11.84PYY51 pKa = 11.24YY52 pKa = 9.69GMSYY56 pKa = 9.79KK57 pKa = 10.39HH58 pKa = 5.88QLIFLTEE65 pKa = 3.95YY66 pKa = 10.72IMALEE71 pKa = 4.19EE72 pKa = 4.02
Molecular weight: 8.28 kDa
Isoelectric point according different methods:
Protein with the highest isoelectric point:
>tr|Q597W7|Q597W7_9CAUD Putative DNA binding protein OS=Lactobacillus virus phiJL1 OX=235201 PE=4 SV=1
MM1 pKa = 7.57ACLSRR6 pKa = 11.84KK7 pKa = 7.72ATNGSSIISVWAKK20 pKa = 9.72TNSNMADD27 pKa = 3.19NRR29 pKa = 11.84GVGG32 pKa = 3.22
MM1 pKa = 7.57ACLSRR6 pKa = 11.84KK7 pKa = 7.72ATNGSSIISVWAKK20 pKa = 9.72TNSNMADD27 pKa = 3.19NRR29 pKa = 11.84GVGG32 pKa = 3.22
Molecular weight: 3.34 kDa
Isoelectric point according different methods:
Peptides (in silico digests for buttom-up proteomics)
Below you can find in silico digests of the whole proteome with Trypsin, Chymotrypsin, Trypsin+LysC, LysN, ArgC proteases suitable for different mass spec machines.| Try ESI |
 |
|---|
| ChTry ESI |
|
|---|
| ArgC ESI |
|
|---|
| LysN ESI |
|
|---|
| TryLysC ESI |
|
|---|
| Try MALDI |
|
|---|
| ChTry MALDI |
|
|---|
| ArgC MALDI |
|
|---|
| LysN MALDI |
|
|---|
| TryLysC MALDI |
|
|---|
| Try LTQ |
|
|---|
| ChTry LTQ |
|
|---|
| ArgC LTQ |
|
|---|
| LysN LTQ |
|
|---|
| TryLysC LTQ |
|
|---|
| Try MSlow |
|
|---|
| ChTry MSlow |
|
|---|
| ArgC MSlow |
|
|---|
| LysN MSlow |
|
|---|
| TryLysC MSlow |
|
|---|
| Try MShigh |
|
|---|
| ChTry MShigh |
|
|---|
| ArgC MShigh |
|
|---|
| LysN MShigh |
|
|---|
| TryLysC MShigh |
|
|---|
General Statistics
Number of major isoforms |
Number of additional isoforms |
Number of all proteins |
Number of amino acids |
Min. Seq. Length |
Max. Seq. Length |
Avg. Seq. Length |
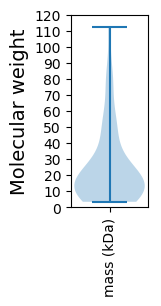
Avg. Mol. Weight |
|---|---|---|---|---|---|---|---|
0 |
10472 |
32 |
1133 |
227.7 |
25.21 |
Amino acid frequency
Ala |
Cys |
Asp |
Glu |
Phe |
Gly |
His |
Ile |
Lys |
Leu |
|---|---|---|---|---|---|---|---|---|---|
8.403 ± 1.069 | 0.497 ± 0.099 |
6.828 ± 0.425 | 5.529 ± 0.506 |
3.657 ± 0.166 | 6.981 ± 0.49 |
1.385 ± 0.18 | 6.694 ± 0.261 |
7.238 ± 0.354 | 7.267 ± 0.271 |
Met |
Asn |
Gln |
Pro |
Arg |
Ser |
Thr |
Val |
Trp |
Tyr |
|---|---|---|---|---|---|---|---|---|---|
2.702 ± 0.203 | 6.035 ± 0.364 |
2.884 ± 0.202 | 3.571 ± 0.161 |
3.457 ± 0.353 | 7.429 ± 0.516 |
6.885 ± 0.377 | 7.076 ± 0.25 |
1.003 ± 0.103 | 4.479 ± 0.456 |
Most of the basic statistics you can see at this page can be downloaded from this CSV file
See this proteome in:

Proteome-pI is available under Creative Commons Attribution-NoDerivs license, for more details see here
| Reference: Kozlowski LP. Proteome-pI 2.0: Proteome Isoelectric Point Database Update. Nucleic Acids Res. 2021, doi: 10.1093/nar/gkab944 | Contact: Lukasz P. Kozlowski |