Tuber magnatum (white Piedmont truffle)
Taxonomy: cellular organisms; Eukaryota; Opisthokonta; Fungi; Dikarya; Ascomycota; saccharomyceta; Pezizomycotina; Pezizomycetes; Pezizales; Tuberaceae; Tuber
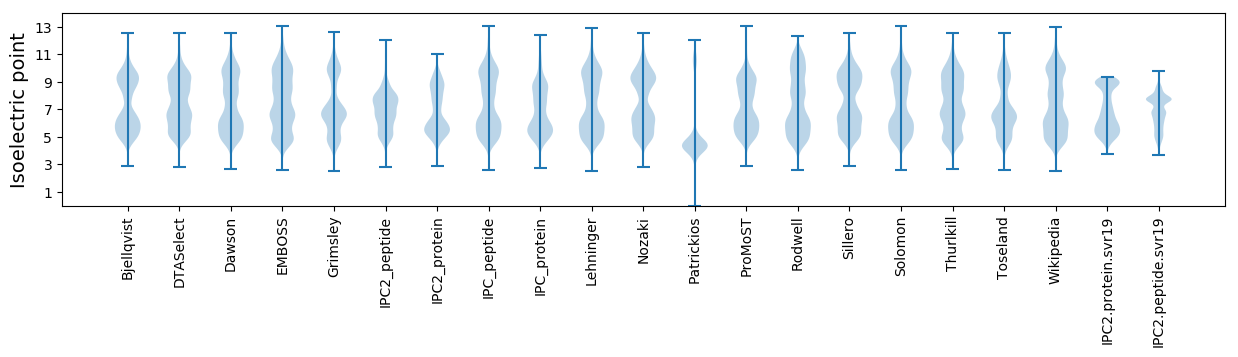
Average proteome isoelectric point is 6.83
Get precalculated fractions of proteins

Virtual 2D-PAGE plot for 9390 proteins (isoelectric point calculated using IPC2_protein)
Get csv file with sequences according to given criteria:
* You can choose from 21 different methods for calculating isoelectric point
Summary statistics related to proteome-wise predictions
Protein with the lowest isoelectric point:
>tr|A0A317SDW5|A0A317SDW5_9PEZI Uncharacterized protein OS=Tuber magnatum OX=42249 GN=C7212DRAFT_348210 PE=4 SV=1
MM1 pKa = 8.08DD2 pKa = 5.95LPTTNSISKK11 pKa = 10.25SSSPDD16 pKa = 2.74TDD18 pKa = 5.98ANTTWLAQDD27 pKa = 3.78ISTLPDD33 pKa = 3.35SLEE36 pKa = 4.11LPEE39 pKa = 5.44LCDD42 pKa = 4.52FGIDD46 pKa = 3.73TVLEE50 pKa = 4.23LCDD53 pKa = 5.86FEE55 pKa = 6.51LCDD58 pKa = 4.73FDD60 pKa = 6.33IDD62 pKa = 4.94ILPEE66 pKa = 4.33LCDD69 pKa = 4.27FDD71 pKa = 6.1IDD73 pKa = 4.28TLPEE77 pKa = 4.3LCDD80 pKa = 4.13FDD82 pKa = 6.08IDD84 pKa = 4.22TLPEE88 pKa = 4.06SCDD91 pKa = 3.46ANTNTLSEE99 pKa = 4.41YY100 pKa = 11.2CNIDD104 pKa = 4.01PNSLPPLQDD113 pKa = 3.38FLEE116 pKa = 4.48LLSEE120 pKa = 4.23PMDD123 pKa = 3.83VEE125 pKa = 4.49SLCASWNLGMGSDD138 pKa = 3.69EE139 pKa = 4.75TICKK143 pKa = 10.31VGEE146 pKa = 4.47DD147 pKa = 3.98DD148 pKa = 5.43DD149 pKa = 6.56AGILEE154 pKa = 4.21WTGDD158 pKa = 3.65EE159 pKa = 4.21EE160 pKa = 5.32HH161 pKa = 6.97FGRR164 pKa = 11.84PNCTSEE170 pKa = 4.34GSVSGSHH177 pKa = 7.04RR178 pKa = 11.84LTNQEE183 pKa = 3.95LAEE186 pKa = 3.94QLKK189 pKa = 9.25QLKK192 pKa = 10.31GDD194 pKa = 4.19LEE196 pKa = 4.33QVTRR200 pKa = 11.84ALVVLDD206 pKa = 4.01SYY208 pKa = 10.31IAQMIPWSFSIHH220 pKa = 5.59NAVHH224 pKa = 5.81KK225 pKa = 9.78TNTLPAGVLGSPNPTPRR242 pKa = 4.4
MM1 pKa = 8.08DD2 pKa = 5.95LPTTNSISKK11 pKa = 10.25SSSPDD16 pKa = 2.74TDD18 pKa = 5.98ANTTWLAQDD27 pKa = 3.78ISTLPDD33 pKa = 3.35SLEE36 pKa = 4.11LPEE39 pKa = 5.44LCDD42 pKa = 4.52FGIDD46 pKa = 3.73TVLEE50 pKa = 4.23LCDD53 pKa = 5.86FEE55 pKa = 6.51LCDD58 pKa = 4.73FDD60 pKa = 6.33IDD62 pKa = 4.94ILPEE66 pKa = 4.33LCDD69 pKa = 4.27FDD71 pKa = 6.1IDD73 pKa = 4.28TLPEE77 pKa = 4.3LCDD80 pKa = 4.13FDD82 pKa = 6.08IDD84 pKa = 4.22TLPEE88 pKa = 4.06SCDD91 pKa = 3.46ANTNTLSEE99 pKa = 4.41YY100 pKa = 11.2CNIDD104 pKa = 4.01PNSLPPLQDD113 pKa = 3.38FLEE116 pKa = 4.48LLSEE120 pKa = 4.23PMDD123 pKa = 3.83VEE125 pKa = 4.49SLCASWNLGMGSDD138 pKa = 3.69EE139 pKa = 4.75TICKK143 pKa = 10.31VGEE146 pKa = 4.47DD147 pKa = 3.98DD148 pKa = 5.43DD149 pKa = 6.56AGILEE154 pKa = 4.21WTGDD158 pKa = 3.65EE159 pKa = 4.21EE160 pKa = 5.32HH161 pKa = 6.97FGRR164 pKa = 11.84PNCTSEE170 pKa = 4.34GSVSGSHH177 pKa = 7.04RR178 pKa = 11.84LTNQEE183 pKa = 3.95LAEE186 pKa = 3.94QLKK189 pKa = 9.25QLKK192 pKa = 10.31GDD194 pKa = 4.19LEE196 pKa = 4.33QVTRR200 pKa = 11.84ALVVLDD206 pKa = 4.01SYY208 pKa = 10.31IAQMIPWSFSIHH220 pKa = 5.59NAVHH224 pKa = 5.81KK225 pKa = 9.78TNTLPAGVLGSPNPTPRR242 pKa = 4.4
Molecular weight: 26.58 kDa
Isoelectric point according different methods:
Protein with the highest isoelectric point:
>tr|A0A317SVA2|A0A317SVA2_9PEZI Probable vacuolar protein sorting-associated protein 16 homolog OS=Tuber magnatum OX=42249 GN=C7212DRAFT_296902 PE=3 SV=1
MM1 pKa = 7.94PSQKK5 pKa = 10.41SFRR8 pKa = 11.84TKK10 pKa = 10.38QKK12 pKa = 9.84LAKK15 pKa = 9.55AQKK18 pKa = 8.59QNRR21 pKa = 11.84PIPQWIRR28 pKa = 11.84LRR30 pKa = 11.84TGNTIRR36 pKa = 11.84YY37 pKa = 5.79NAKK40 pKa = 8.89RR41 pKa = 11.84RR42 pKa = 11.84HH43 pKa = 4.15WRR45 pKa = 11.84KK46 pKa = 7.38TRR48 pKa = 11.84IGII51 pKa = 4.0
MM1 pKa = 7.94PSQKK5 pKa = 10.41SFRR8 pKa = 11.84TKK10 pKa = 10.38QKK12 pKa = 9.84LAKK15 pKa = 9.55AQKK18 pKa = 8.59QNRR21 pKa = 11.84PIPQWIRR28 pKa = 11.84LRR30 pKa = 11.84TGNTIRR36 pKa = 11.84YY37 pKa = 5.79NAKK40 pKa = 8.89RR41 pKa = 11.84RR42 pKa = 11.84HH43 pKa = 4.15WRR45 pKa = 11.84KK46 pKa = 7.38TRR48 pKa = 11.84IGII51 pKa = 4.0
Molecular weight: 6.24 kDa
Isoelectric point according different methods:
Peptides (in silico digests for buttom-up proteomics)
Below you can find in silico digests of the whole proteome with Trypsin, Chymotrypsin, Trypsin+LysC, LysN, ArgC proteases suitable for different mass spec machines.| Try ESI |
 |
|---|
| ChTry ESI |
|
|---|
| ArgC ESI |
|
|---|
| LysN ESI |
|
|---|
| TryLysC ESI |
|
|---|
| Try MALDI |
|
|---|
| ChTry MALDI |
|
|---|
| ArgC MALDI |
|
|---|
| LysN MALDI |
|
|---|
| TryLysC MALDI |
|
|---|
| Try LTQ |
|
|---|
| ChTry LTQ |
|
|---|
| ArgC LTQ |
|
|---|
| LysN LTQ |
|
|---|
| TryLysC LTQ |
|
|---|
| Try MSlow |
|
|---|
| ChTry MSlow |
|
|---|
| ArgC MSlow |
|
|---|
| LysN MSlow |
|
|---|
| TryLysC MSlow |
|
|---|
| Try MShigh |
|
|---|
| ChTry MShigh |
|
|---|
| ArgC MShigh |
|
|---|
| LysN MShigh |
|
|---|
| TryLysC MShigh |
|
|---|
General Statistics
Number of major isoforms |
Number of additional isoforms |
Number of all proteins |
Number of amino acids |
Min. Seq. Length |
Max. Seq. Length |
Avg. Seq. Length |
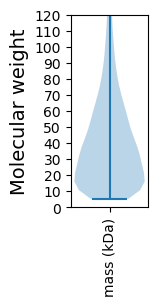
Avg. Mol. Weight |
|---|---|---|---|---|---|---|---|
0 |
3818676 |
49 |
4889 |
406.7 |
44.97 |
Amino acid frequency
Ala |
Cys |
Asp |
Glu |
Phe |
Gly |
His |
Ile |
Lys |
Leu |
|---|---|---|---|---|---|---|---|---|---|
7.951 ± 0.021 | 1.269 ± 0.01 |
5.294 ± 0.017 | 6.715 ± 0.026 |
3.598 ± 0.015 | 7.604 ± 0.023 |
2.32 ± 0.014 | 4.975 ± 0.015 |
5.218 ± 0.023 | 8.885 ± 0.03 |
Met |
Asn |
Gln |
Pro |
Arg |
Ser |
Thr |
Val |
Trp |
Tyr |
|---|---|---|---|---|---|---|---|---|---|
2.133 ± 0.009 | 3.612 ± 0.015 |
6.198 ± 0.03 | 3.527 ± 0.022 |
6.435 ± 0.022 | 8.092 ± 0.027 |
5.838 ± 0.018 | 6.269 ± 0.02 |
1.357 ± 0.008 | 2.708 ± 0.012 |
Most of the basic statistics you can see at this page can be downloaded from this CSV file
See this proteome in:

Proteome-pI is available under Creative Commons Attribution-NoDerivs license, for more details see here
| Reference: Kozlowski LP. Proteome-pI 2.0: Proteome Isoelectric Point Database Update. Nucleic Acids Res. 2021, doi: 10.1093/nar/gkab944 | Contact: Lukasz P. Kozlowski |