bacterium AM6
Taxonomy: cellular organisms; Bacteria; unclassified Bacteria
Average proteome isoelectric point is 6.69
Get precalculated fractions of proteins
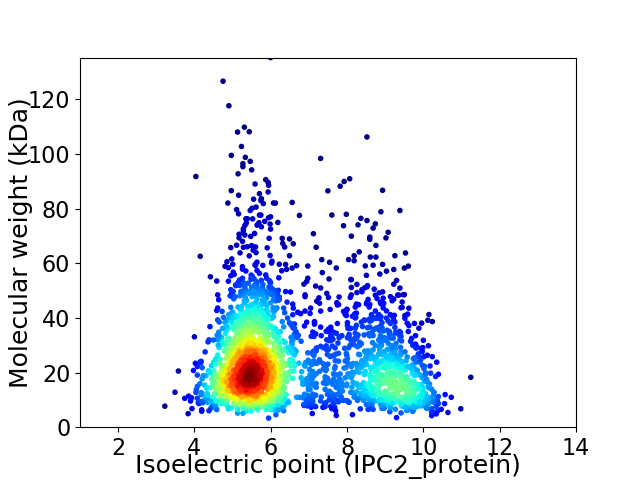
Virtual 2D-PAGE plot for 2443 proteins (isoelectric point calculated using IPC2_protein)
Get csv file with sequences according to given criteria:
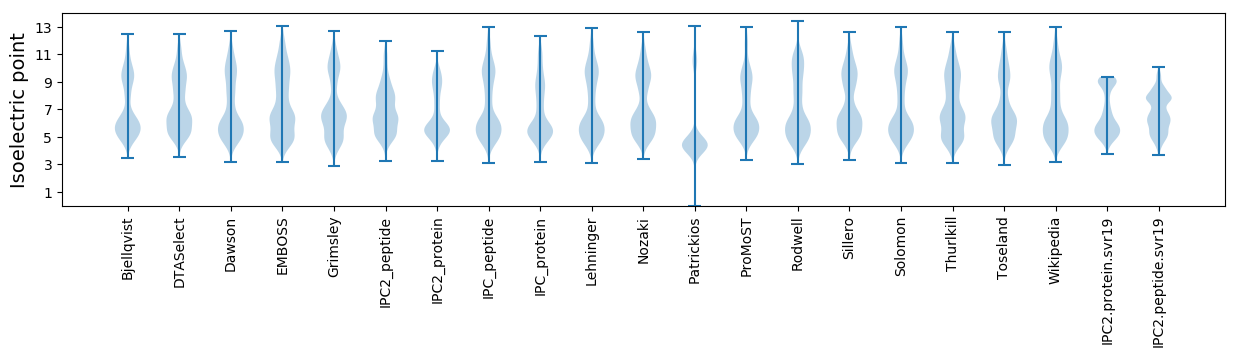
* You can choose from 21 different methods for calculating isoelectric point
Summary statistics related to proteome-wise predictions
Protein with the lowest isoelectric point:
>tr|A0A244C4N4|A0A244C4N4_9BACT Carboxymuconolactone decarboxylase family protein OS=bacterium AM6 OX=1954209 GN=B0X78_02875 PE=4 SV=1
MM1 pKa = 7.41LAVTLVLIALVLGLNLVASFVVLGRR26 pKa = 11.84DD27 pKa = 3.63DD28 pKa = 5.25LPASSRR34 pKa = 11.84AGQLLVVWLLPLVGAIVCMAMATADD59 pKa = 3.88GSPARR64 pKa = 11.84ADD66 pKa = 3.61GSGGGPADD74 pKa = 3.68FSGGYY79 pKa = 9.87SGDD82 pKa = 4.04SNSHH86 pKa = 6.05HH87 pKa = 7.19SYY89 pKa = 10.86SSSDD93 pKa = 3.58CSSGDD98 pKa = 3.28SGGGGDD104 pKa = 4.71GGSCGGGDD112 pKa = 3.22
MM1 pKa = 7.41LAVTLVLIALVLGLNLVASFVVLGRR26 pKa = 11.84DD27 pKa = 3.63DD28 pKa = 5.25LPASSRR34 pKa = 11.84AGQLLVVWLLPLVGAIVCMAMATADD59 pKa = 3.88GSPARR64 pKa = 11.84ADD66 pKa = 3.61GSGGGPADD74 pKa = 3.68FSGGYY79 pKa = 9.87SGDD82 pKa = 4.04SNSHH86 pKa = 6.05HH87 pKa = 7.19SYY89 pKa = 10.86SSSDD93 pKa = 3.58CSSGDD98 pKa = 3.28SGGGGDD104 pKa = 4.71GGSCGGGDD112 pKa = 3.22
Molecular weight: 10.76 kDa
Isoelectric point according different methods:
Protein with the highest isoelectric point:
>tr|A0A244C399|A0A244C399_9BACT LysR family transcriptional regulator OS=bacterium AM6 OX=1954209 GN=B0X78_07990 PE=3 SV=1
RR1 pKa = 7.66KK2 pKa = 9.88VVGKK6 pKa = 10.23KK7 pKa = 9.83AATAKK12 pKa = 10.43KK13 pKa = 10.32VVGKK17 pKa = 8.64KK18 pKa = 7.51TAVAKK23 pKa = 10.36KK24 pKa = 9.51VAGKK28 pKa = 10.06KK29 pKa = 8.87VAATRR34 pKa = 11.84KK35 pKa = 7.28TVAKK39 pKa = 10.07KK40 pKa = 9.95AAPLKK45 pKa = 10.6KK46 pKa = 10.11AVAKK50 pKa = 9.98KK51 pKa = 10.51APAKK55 pKa = 10.07KK56 pKa = 9.98AVRR59 pKa = 11.84KK60 pKa = 8.38AAKK63 pKa = 9.9RR64 pKa = 11.84KK65 pKa = 9.33
RR1 pKa = 7.66KK2 pKa = 9.88VVGKK6 pKa = 10.23KK7 pKa = 9.83AATAKK12 pKa = 10.43KK13 pKa = 10.32VVGKK17 pKa = 8.64KK18 pKa = 7.51TAVAKK23 pKa = 10.36KK24 pKa = 9.51VAGKK28 pKa = 10.06KK29 pKa = 8.87VAATRR34 pKa = 11.84KK35 pKa = 7.28TVAKK39 pKa = 10.07KK40 pKa = 9.95AAPLKK45 pKa = 10.6KK46 pKa = 10.11AVAKK50 pKa = 9.98KK51 pKa = 10.51APAKK55 pKa = 10.07KK56 pKa = 9.98AVRR59 pKa = 11.84KK60 pKa = 8.38AAKK63 pKa = 9.9RR64 pKa = 11.84KK65 pKa = 9.33
Molecular weight: 6.74 kDa
Isoelectric point according different methods:
Peptides (in silico digests for buttom-up proteomics)
Below you can find in silico digests of the whole proteome with Trypsin, Chymotrypsin, Trypsin+LysC, LysN, ArgC proteases suitable for different mass spec machines.| Try ESI |
 |
|---|
| ChTry ESI |
|
|---|
| ArgC ESI |
|
|---|
| LysN ESI |
|
|---|
| TryLysC ESI |
|
|---|
| Try MALDI |
|
|---|
| ChTry MALDI |
|
|---|
| ArgC MALDI |
|
|---|
| LysN MALDI |
|
|---|
| TryLysC MALDI |
|
|---|
| Try LTQ |
|
|---|
| ChTry LTQ |
|
|---|
| ArgC LTQ |
|
|---|
| LysN LTQ |
|
|---|
| TryLysC LTQ |
|
|---|
| Try MSlow |
|
|---|
| ChTry MSlow |
|
|---|
| ArgC MSlow |
|
|---|
| LysN MSlow |
|
|---|
| TryLysC MSlow |
|
|---|
| Try MShigh |
|
|---|
| ChTry MShigh |
|
|---|
| ArgC MShigh |
|
|---|
| LysN MShigh |
|
|---|
| TryLysC MShigh |
|
|---|
General Statistics
Number of major isoforms |
Number of additional isoforms |
Number of all proteins |
Number of amino acids |
Min. Seq. Length |
Max. Seq. Length |
Avg. Seq. Length |
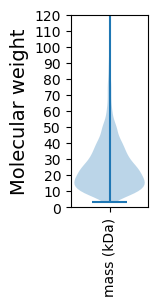
Avg. Mol. Weight |
|---|---|---|---|---|---|---|---|
0 |
601141 |
30 |
1228 |
246.1 |
26.73 |
Amino acid frequency
Ala |
Cys |
Asp |
Glu |
Phe |
Gly |
His |
Ile |
Lys |
Leu |
|---|---|---|---|---|---|---|---|---|---|
12.886 ± 0.081 | 0.908 ± 0.016 |
5.705 ± 0.039 | 5.056 ± 0.054 |
3.317 ± 0.033 | 8.498 ± 0.067 |
2.279 ± 0.027 | 4.042 ± 0.037 |
2.818 ± 0.049 | 11.002 ± 0.069 |
Met |
Asn |
Gln |
Pro |
Arg |
Ser |
Thr |
Val |
Trp |
Tyr |
|---|---|---|---|---|---|---|---|---|---|
2.268 ± 0.027 | 2.604 ± 0.038 |
5.264 ± 0.037 | 4.377 ± 0.044 |
7.377 ± 0.047 | 5.392 ± 0.04 |
4.93 ± 0.046 | 7.457 ± 0.04 |
1.58 ± 0.025 | 2.24 ± 0.025 |
Most of the basic statistics you can see at this page can be downloaded from this CSV file
See this proteome in:

Proteome-pI is available under Creative Commons Attribution-NoDerivs license, for more details see here
| Reference: Kozlowski LP. Proteome-pI 2.0: Proteome Isoelectric Point Database Update. Nucleic Acids Res. 2021, doi: 10.1093/nar/gkab944 | Contact: Lukasz P. Kozlowski |