Schaalia turicensis ACS-279-V-Col4
Taxonomy: cellular organisms; Bacteria; Terrabacteria group; Actinobacteria; Actinomycetia; Actinomycetales; Actinomycetaceae; Schaalia; Schaalia turicensis
Average proteome isoelectric point is 5.9
Get precalculated fractions of proteins
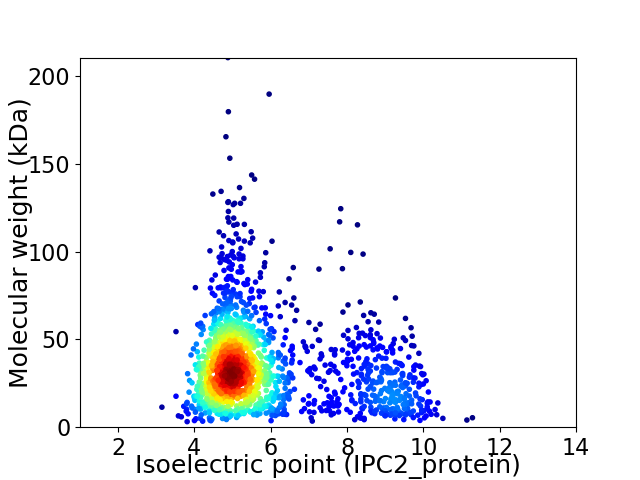
Virtual 2D-PAGE plot for 1709 proteins (isoelectric point calculated using IPC2_protein)
Get csv file with sequences according to given criteria:
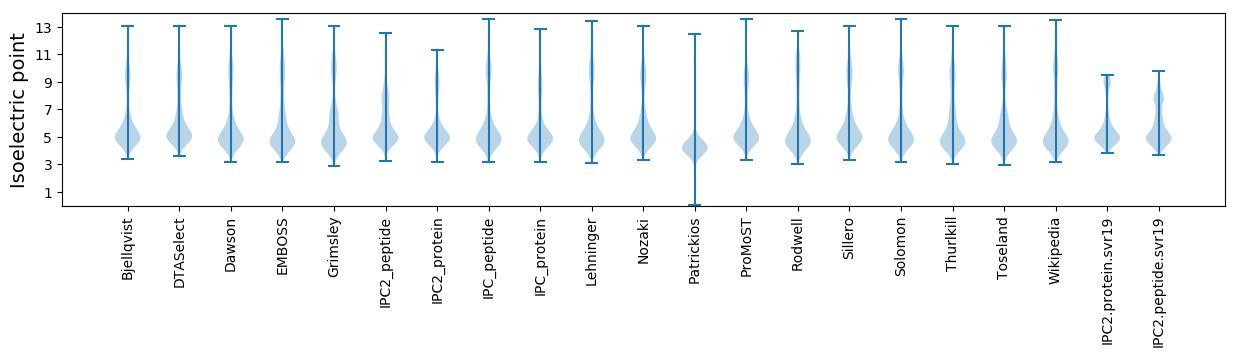
* You can choose from 21 different methods for calculating isoelectric point
Summary statistics related to proteome-wise predictions
Protein with the lowest isoelectric point:
>tr|K0YXG0|K0YXG0_9ACTO Thioredoxin OS=Schaalia turicensis ACS-279-V-Col4 OX=883077 GN=HMPREF9241_00179 PE=3 SV=1
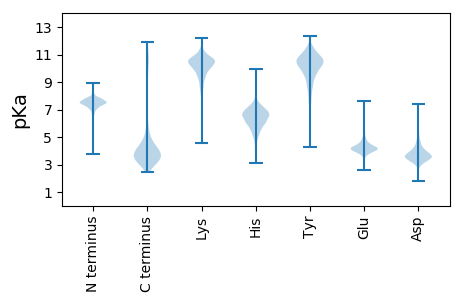
MM1 pKa = 7.77EE2 pKa = 6.23DD3 pKa = 3.11GHH5 pKa = 7.46EE6 pKa = 4.55GEE8 pKa = 5.07LSGEE12 pKa = 3.81AAEE15 pKa = 5.31AYY17 pKa = 9.55DD18 pKa = 3.87VLYY21 pKa = 10.89DD22 pKa = 6.13AITKK26 pKa = 10.26DD27 pKa = 3.54NQQ29 pKa = 3.12
MM1 pKa = 7.77EE2 pKa = 6.23DD3 pKa = 3.11GHH5 pKa = 7.46EE6 pKa = 4.55GEE8 pKa = 5.07LSGEE12 pKa = 3.81AAEE15 pKa = 5.31AYY17 pKa = 9.55DD18 pKa = 3.87VLYY21 pKa = 10.89DD22 pKa = 6.13AITKK26 pKa = 10.26DD27 pKa = 3.54NQQ29 pKa = 3.12
Molecular weight: 3.17 kDa
Isoelectric point according different methods:
Protein with the highest isoelectric point:
>tr|K0Z7Q2|K0Z7Q2_9ACTO Phosphoenolpyruvate carboxykinase [GTP] OS=Schaalia turicensis ACS-279-V-Col4 OX=883077 GN=pckG PE=3 SV=1
MM1 pKa = 5.72TTKK4 pKa = 9.84RR5 pKa = 11.84TFQPNNRR12 pKa = 11.84RR13 pKa = 11.84RR14 pKa = 11.84AKK16 pKa = 8.7THH18 pKa = 5.16GFRR21 pKa = 11.84LRR23 pKa = 11.84MSTRR27 pKa = 11.84AGRR30 pKa = 11.84AILSSRR36 pKa = 11.84RR37 pKa = 11.84RR38 pKa = 11.84KK39 pKa = 9.86GRR41 pKa = 11.84AKK43 pKa = 10.68LSAA46 pKa = 3.92
MM1 pKa = 5.72TTKK4 pKa = 9.84RR5 pKa = 11.84TFQPNNRR12 pKa = 11.84RR13 pKa = 11.84RR14 pKa = 11.84AKK16 pKa = 8.7THH18 pKa = 5.16GFRR21 pKa = 11.84LRR23 pKa = 11.84MSTRR27 pKa = 11.84AGRR30 pKa = 11.84AILSSRR36 pKa = 11.84RR37 pKa = 11.84RR38 pKa = 11.84KK39 pKa = 9.86GRR41 pKa = 11.84AKK43 pKa = 10.68LSAA46 pKa = 3.92
Molecular weight: 5.39 kDa
Isoelectric point according different methods:
Peptides (in silico digests for buttom-up proteomics)
Below you can find in silico digests of the whole proteome with Trypsin, Chymotrypsin, Trypsin+LysC, LysN, ArgC proteases suitable for different mass spec machines.| Try ESI |
 |
|---|
| ChTry ESI |
|
|---|
| ArgC ESI |
|
|---|
| LysN ESI |
|
|---|
| TryLysC ESI |
|
|---|
| Try MALDI |
|
|---|
| ChTry MALDI |
|
|---|
| ArgC MALDI |
|
|---|
| LysN MALDI |
|
|---|
| TryLysC MALDI |
|
|---|
| Try LTQ |
|
|---|
| ChTry LTQ |
|
|---|
| ArgC LTQ |
|
|---|
| LysN LTQ |
|
|---|
| TryLysC LTQ |
|
|---|
| Try MSlow |
|
|---|
| ChTry MSlow |
|
|---|
| ArgC MSlow |
|
|---|
| LysN MSlow |
|
|---|
| TryLysC MSlow |
|
|---|
| Try MShigh |
|
|---|
| ChTry MShigh |
|
|---|
| ArgC MShigh |
|
|---|
| LysN MShigh |
|
|---|
| TryLysC MShigh |
|
|---|
General Statistics
Number of major isoforms |
Number of additional isoforms |
Number of all proteins |
Number of amino acids |
Min. Seq. Length |
Max. Seq. Length |
Avg. Seq. Length |
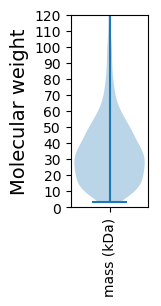
Avg. Mol. Weight |
|---|---|---|---|---|---|---|---|
0 |
574013 |
29 |
1930 |
335.9 |
36.39 |
Amino acid frequency
Ala |
Cys |
Asp |
Glu |
Phe |
Gly |
His |
Ile |
Lys |
Leu |
|---|---|---|---|---|---|---|---|---|---|
11.237 ± 0.068 | 0.773 ± 0.017 |
6.217 ± 0.041 | 6.16 ± 0.059 |
3.138 ± 0.038 | 8.214 ± 0.056 |
2.138 ± 0.026 | 5.412 ± 0.039 |
3.377 ± 0.058 | 9.414 ± 0.063 |
Met |
Asn |
Gln |
Pro |
Arg |
Ser |
Thr |
Val |
Trp |
Tyr |
|---|---|---|---|---|---|---|---|---|---|
2.331 ± 0.026 | 2.793 ± 0.038 |
4.797 ± 0.04 | 3.288 ± 0.038 |
6.132 ± 0.058 | 6.452 ± 0.061 |
6.256 ± 0.045 | 8.244 ± 0.052 |
1.439 ± 0.026 | 2.187 ± 0.034 |
Most of the basic statistics you can see at this page can be downloaded from this CSV file
See this proteome in:

Proteome-pI is available under Creative Commons Attribution-NoDerivs license, for more details see here
| Reference: Kozlowski LP. Proteome-pI 2.0: Proteome Isoelectric Point Database Update. Nucleic Acids Res. 2021, doi: 10.1093/nar/gkab944 | Contact: Lukasz P. Kozlowski |