Capybara microvirus Cap1_SP_223
Taxonomy: Viruses; Monodnaviria; Sangervirae; Phixviricota; Malgrandaviricetes; Petitvirales; Microviridae; unclassified Microviridae
Average proteome isoelectric point is 5.6
Get precalculated fractions of proteins
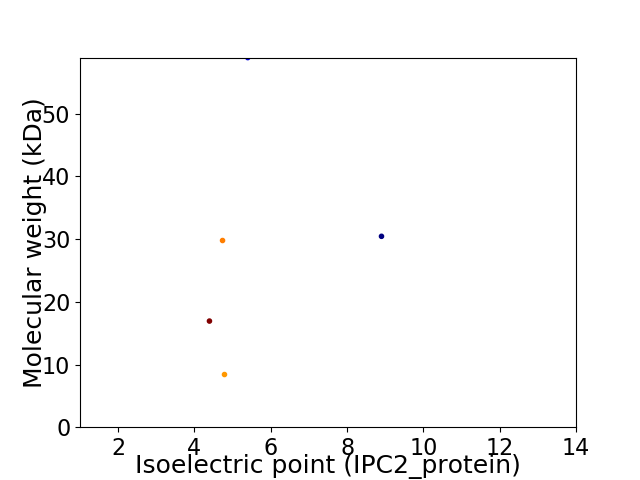
Virtual 2D-PAGE plot for 5 proteins (isoelectric point calculated using IPC2_protein)
Get csv file with sequences according to given criteria:
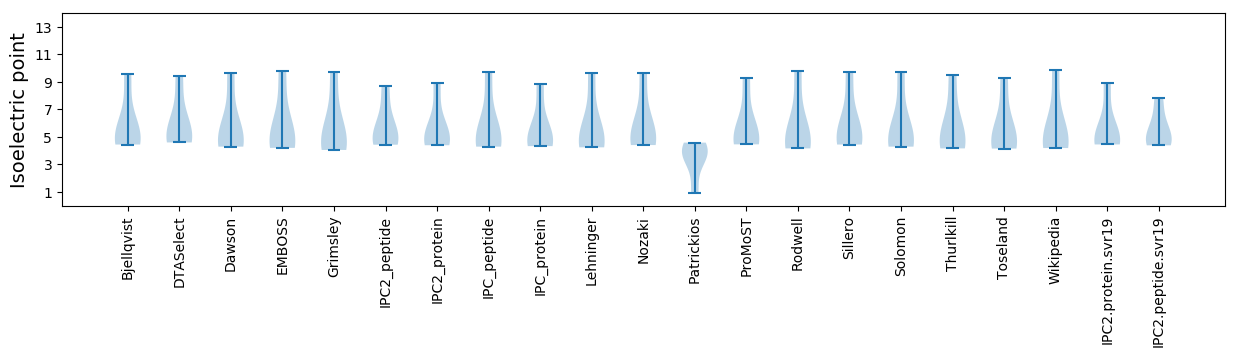
* You can choose from 21 different methods for calculating isoelectric point
Summary statistics related to proteome-wise predictions
Protein with the lowest isoelectric point:
>tr|A0A4P8W5P8|A0A4P8W5P8_9VIRU Minor capsid protein OS=Capybara microvirus Cap1_SP_223 OX=2585414 PE=4 SV=1
MM1 pKa = 7.59ASIFRR6 pKa = 11.84TGPIVGQTFRR16 pKa = 11.84RR17 pKa = 11.84FYY19 pKa = 10.53PKK21 pKa = 10.58YY22 pKa = 10.14GLGKK26 pKa = 10.17DD27 pKa = 3.73GYY29 pKa = 10.46LVEE32 pKa = 4.61LPEE35 pKa = 5.39VIDD38 pKa = 3.65NQQIIDD44 pKa = 3.93DD45 pKa = 4.97AYY47 pKa = 10.99DD48 pKa = 3.97DD49 pKa = 4.24SLNVLLDD56 pKa = 3.44KK57 pKa = 11.12YY58 pKa = 10.45IYY60 pKa = 10.56EE61 pKa = 4.68PVLEE65 pKa = 4.59DD66 pKa = 3.69QNDD69 pKa = 3.52YY70 pKa = 11.47SDD72 pKa = 5.8DD73 pKa = 4.3YY74 pKa = 11.45IDD76 pKa = 3.73YY77 pKa = 10.84RR78 pKa = 11.84RR79 pKa = 11.84DD80 pKa = 3.3ANALEE85 pKa = 4.56SFLKK89 pKa = 10.5ADD91 pKa = 3.69EE92 pKa = 4.55LAAEE96 pKa = 4.26LRR98 pKa = 11.84VAYY101 pKa = 9.55GMPRR105 pKa = 11.84ASISDD110 pKa = 3.54LRR112 pKa = 11.84KK113 pKa = 10.41EE114 pKa = 3.57MDD116 pKa = 3.2KK117 pKa = 10.99RR118 pKa = 11.84FSKK121 pKa = 11.16YY122 pKa = 8.18EE123 pKa = 4.14SKK125 pKa = 10.84EE126 pKa = 3.69VTFDD130 pKa = 3.21EE131 pKa = 4.77KK132 pKa = 11.29AQNEE136 pKa = 4.35TVEE139 pKa = 4.19VGKK142 pKa = 10.53QEE144 pKa = 4.24VVV146 pKa = 2.95
MM1 pKa = 7.59ASIFRR6 pKa = 11.84TGPIVGQTFRR16 pKa = 11.84RR17 pKa = 11.84FYY19 pKa = 10.53PKK21 pKa = 10.58YY22 pKa = 10.14GLGKK26 pKa = 10.17DD27 pKa = 3.73GYY29 pKa = 10.46LVEE32 pKa = 4.61LPEE35 pKa = 5.39VIDD38 pKa = 3.65NQQIIDD44 pKa = 3.93DD45 pKa = 4.97AYY47 pKa = 10.99DD48 pKa = 3.97DD49 pKa = 4.24SLNVLLDD56 pKa = 3.44KK57 pKa = 11.12YY58 pKa = 10.45IYY60 pKa = 10.56EE61 pKa = 4.68PVLEE65 pKa = 4.59DD66 pKa = 3.69QNDD69 pKa = 3.52YY70 pKa = 11.47SDD72 pKa = 5.8DD73 pKa = 4.3YY74 pKa = 11.45IDD76 pKa = 3.73YY77 pKa = 10.84RR78 pKa = 11.84RR79 pKa = 11.84DD80 pKa = 3.3ANALEE85 pKa = 4.56SFLKK89 pKa = 10.5ADD91 pKa = 3.69EE92 pKa = 4.55LAAEE96 pKa = 4.26LRR98 pKa = 11.84VAYY101 pKa = 9.55GMPRR105 pKa = 11.84ASISDD110 pKa = 3.54LRR112 pKa = 11.84KK113 pKa = 10.41EE114 pKa = 3.57MDD116 pKa = 3.2KK117 pKa = 10.99RR118 pKa = 11.84FSKK121 pKa = 11.16YY122 pKa = 8.18EE123 pKa = 4.14SKK125 pKa = 10.84EE126 pKa = 3.69VTFDD130 pKa = 3.21EE131 pKa = 4.77KK132 pKa = 11.29AQNEE136 pKa = 4.35TVEE139 pKa = 4.19VGKK142 pKa = 10.53QEE144 pKa = 4.24VVV146 pKa = 2.95
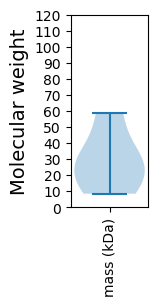
Molecular weight: 16.93 kDa
Isoelectric point according different methods:
Protein with the highest isoelectric point:
>tr|A0A4P8W874|A0A4P8W874_9VIRU Replication initiator protein OS=Capybara microvirus Cap1_SP_223 OX=2585414 PE=4 SV=1
MM1 pKa = 7.49KK2 pKa = 10.11CLSPFFTSLGPVPCGRR18 pKa = 11.84CINCQINRR26 pKa = 11.84SQQWSIRR33 pKa = 11.84CLDD36 pKa = 3.46EE37 pKa = 5.19FKK39 pKa = 10.12ITGIGFFLTLTFKK52 pKa = 10.27KK53 pKa = 9.19TDD55 pKa = 2.94GKK57 pKa = 10.7LRR59 pKa = 11.84RR60 pKa = 11.84KK61 pKa = 9.29PLQDD65 pKa = 3.06FLKK68 pKa = 10.35RR69 pKa = 11.84LRR71 pKa = 11.84KK72 pKa = 9.65EE73 pKa = 3.45ISPVKK78 pKa = 9.93IRR80 pKa = 11.84YY81 pKa = 7.7FGCGEE86 pKa = 4.06YY87 pKa = 10.56GSKK90 pKa = 10.44GLRR93 pKa = 11.84PHH95 pKa = 5.7YY96 pKa = 10.11HH97 pKa = 6.37LLVFGWRR104 pKa = 11.84PDD106 pKa = 3.52DD107 pKa = 3.71LVSFRR112 pKa = 11.84VDD114 pKa = 2.73RR115 pKa = 11.84KK116 pKa = 10.11GQILYY121 pKa = 10.26RR122 pKa = 11.84SALIEE127 pKa = 4.73RR128 pKa = 11.84IWHH131 pKa = 5.0SHH133 pKa = 4.34TDD135 pKa = 3.16NSYY138 pKa = 8.62VAGFISIGDD147 pKa = 3.72INEE150 pKa = 3.99VTCRR154 pKa = 11.84YY155 pKa = 9.36ASKK158 pKa = 10.44YY159 pKa = 9.49CSKK162 pKa = 10.72LGSFDD167 pKa = 3.8SEE169 pKa = 4.45YY170 pKa = 10.54PPFSAMSTHH179 pKa = 6.74PGIGASSVSLARR191 pKa = 11.84CWQGTIVYY199 pKa = 9.06QNKK202 pKa = 8.78VVPAPRR208 pKa = 11.84YY209 pKa = 10.17YY210 pKa = 9.09ITCLSRR216 pKa = 11.84QGVSVDD222 pKa = 4.22GILADD227 pKa = 3.83RR228 pKa = 11.84RR229 pKa = 11.84SRR231 pKa = 11.84SCLLNGDD238 pKa = 4.28YY239 pKa = 10.64PVLDD243 pKa = 3.63YY244 pKa = 11.9NEE246 pKa = 4.17IEE248 pKa = 4.34RR249 pKa = 11.84ACFEE253 pKa = 3.63ARR255 pKa = 11.84QRR257 pKa = 11.84LEE259 pKa = 3.8RR260 pKa = 11.84KK261 pKa = 9.01IPKK264 pKa = 10.05NGG266 pKa = 3.18
MM1 pKa = 7.49KK2 pKa = 10.11CLSPFFTSLGPVPCGRR18 pKa = 11.84CINCQINRR26 pKa = 11.84SQQWSIRR33 pKa = 11.84CLDD36 pKa = 3.46EE37 pKa = 5.19FKK39 pKa = 10.12ITGIGFFLTLTFKK52 pKa = 10.27KK53 pKa = 9.19TDD55 pKa = 2.94GKK57 pKa = 10.7LRR59 pKa = 11.84RR60 pKa = 11.84KK61 pKa = 9.29PLQDD65 pKa = 3.06FLKK68 pKa = 10.35RR69 pKa = 11.84LRR71 pKa = 11.84KK72 pKa = 9.65EE73 pKa = 3.45ISPVKK78 pKa = 9.93IRR80 pKa = 11.84YY81 pKa = 7.7FGCGEE86 pKa = 4.06YY87 pKa = 10.56GSKK90 pKa = 10.44GLRR93 pKa = 11.84PHH95 pKa = 5.7YY96 pKa = 10.11HH97 pKa = 6.37LLVFGWRR104 pKa = 11.84PDD106 pKa = 3.52DD107 pKa = 3.71LVSFRR112 pKa = 11.84VDD114 pKa = 2.73RR115 pKa = 11.84KK116 pKa = 10.11GQILYY121 pKa = 10.26RR122 pKa = 11.84SALIEE127 pKa = 4.73RR128 pKa = 11.84IWHH131 pKa = 5.0SHH133 pKa = 4.34TDD135 pKa = 3.16NSYY138 pKa = 8.62VAGFISIGDD147 pKa = 3.72INEE150 pKa = 3.99VTCRR154 pKa = 11.84YY155 pKa = 9.36ASKK158 pKa = 10.44YY159 pKa = 9.49CSKK162 pKa = 10.72LGSFDD167 pKa = 3.8SEE169 pKa = 4.45YY170 pKa = 10.54PPFSAMSTHH179 pKa = 6.74PGIGASSVSLARR191 pKa = 11.84CWQGTIVYY199 pKa = 9.06QNKK202 pKa = 8.78VVPAPRR208 pKa = 11.84YY209 pKa = 10.17YY210 pKa = 9.09ITCLSRR216 pKa = 11.84QGVSVDD222 pKa = 4.22GILADD227 pKa = 3.83RR228 pKa = 11.84RR229 pKa = 11.84SRR231 pKa = 11.84SCLLNGDD238 pKa = 4.28YY239 pKa = 10.64PVLDD243 pKa = 3.63YY244 pKa = 11.9NEE246 pKa = 4.17IEE248 pKa = 4.34RR249 pKa = 11.84ACFEE253 pKa = 3.63ARR255 pKa = 11.84QRR257 pKa = 11.84LEE259 pKa = 3.8RR260 pKa = 11.84KK261 pKa = 9.01IPKK264 pKa = 10.05NGG266 pKa = 3.18
Molecular weight: 30.45 kDa
Isoelectric point according different methods:
Peptides (in silico digests for buttom-up proteomics)
Below you can find in silico digests of the whole proteome with Trypsin, Chymotrypsin, Trypsin+LysC, LysN, ArgC proteases suitable for different mass spec machines.| Try ESI |
 |
|---|
| ChTry ESI |
|
|---|
| ArgC ESI |
|
|---|
| LysN ESI |
|
|---|
| TryLysC ESI |
|
|---|
| Try MALDI |
|
|---|
| ChTry MALDI |
|
|---|
| ArgC MALDI |
|
|---|
| LysN MALDI |
|
|---|
| TryLysC MALDI |
|
|---|
| Try LTQ |
|
|---|
| ChTry LTQ |
|
|---|
| ArgC LTQ |
|
|---|
| LysN LTQ |
|
|---|
| TryLysC LTQ |
|
|---|
| Try MSlow |
|
|---|
| ChTry MSlow |
|
|---|
| ArgC MSlow |
|
|---|
| LysN MSlow |
|
|---|
| TryLysC MSlow |
|
|---|
| Try MShigh |
|
|---|
| ChTry MShigh |
|
|---|
| ArgC MShigh |
|
|---|
| LysN MShigh |
|
|---|
| TryLysC MShigh |
|
|---|
General Statistics
Number of major isoforms |
Number of additional isoforms |
Number of all proteins |
Number of amino acids |
Min. Seq. Length |
Max. Seq. Length |
Avg. Seq. Length |
Avg. Mol. Weight |
|---|---|---|---|---|---|---|---|
0 |
1292 |
75 |
527 |
258.4 |
28.9 |
Amino acid frequency
Ala |
Cys |
Asp |
Glu |
Phe |
Gly |
His |
Ile |
Lys |
Leu |
|---|---|---|---|---|---|---|---|---|---|
7.43 ± 2.419 | 1.935 ± 0.878 |
6.192 ± 0.909 | 4.876 ± 0.983 |
5.031 ± 0.47 | 6.579 ± 0.852 |
1.625 ± 0.434 | 5.263 ± 0.694 |
3.87 ± 0.793 | 6.966 ± 0.744 |
Met |
Asn |
Gln |
Pro |
Arg |
Ser |
Thr |
Val |
Trp |
Tyr |
|---|---|---|---|---|---|---|---|---|---|
1.858 ± 0.485 | 5.341 ± 1.018 |
4.412 ± 0.914 | 4.954 ± 0.654 |
5.805 ± 0.946 | 10.372 ± 1.322 |
4.954 ± 0.598 | 6.502 ± 0.751 |
1.471 ± 0.244 | 4.567 ± 0.515 |
Most of the basic statistics you can see at this page can be downloaded from this CSV file
See this proteome in:

Proteome-pI is available under Creative Commons Attribution-NoDerivs license, for more details see here
| Reference: Kozlowski LP. Proteome-pI 2.0: Proteome Isoelectric Point Database Update. Nucleic Acids Res. 2021, doi: 10.1093/nar/gkab944 | Contact: Lukasz P. Kozlowski |