Chitinophaga niabensis
Taxonomy: cellular organisms; Bacteria; FCB group; Bacteroidetes/Chlorobi group; Bacteroidetes; Chitinophagia; Chitinophagales; Chitinophagaceae; Chitinophaga
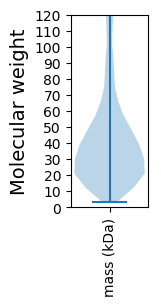
Average proteome isoelectric point is 7.0
Get precalculated fractions of proteins

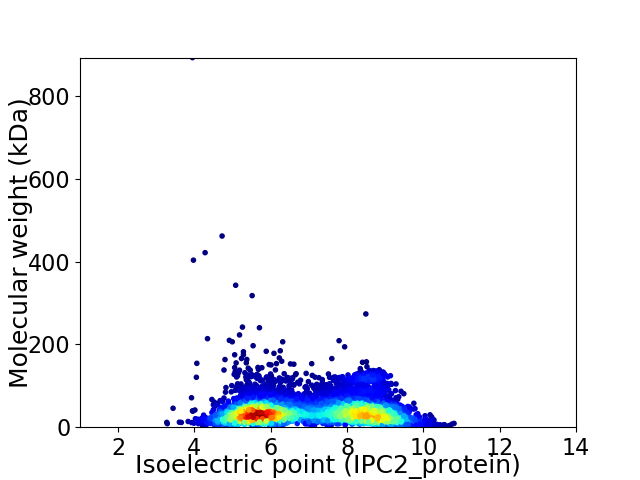
Virtual 2D-PAGE plot for 5774 proteins (isoelectric point calculated using IPC2_protein)
Get csv file with sequences according to given criteria:
* You can choose from 21 different methods for calculating isoelectric point
Summary statistics related to proteome-wise predictions


Protein with the lowest isoelectric point:
>tr|A0A1N6D0D4|A0A1N6D0D4_9BACT HopJ type III effector protein OS=Chitinophaga niabensis OX=536979 GN=SAMN04488055_0019 PE=4 SV=1
NN1 pKa = 7.68DD2 pKa = 3.29TTITQVIHH10 pKa = 5.98VQDD13 pKa = 3.28TTAPVFAVAAPADD26 pKa = 3.88TTVDD30 pKa = 3.98CNSVPAQPVITATDD44 pKa = 3.54NCSVTPNITVTRR56 pKa = 11.84NEE58 pKa = 3.4VRR60 pKa = 11.84TNGTCANSYY69 pKa = 10.4ILTRR73 pKa = 11.84TWTATDD79 pKa = 3.12EE80 pKa = 4.66CGNDD84 pKa = 3.29TTITQVIHH92 pKa = 5.86VQDD95 pKa = 3.75TVAPRR100 pKa = 11.84FNAIAPADD108 pKa = 3.83TTVDD112 pKa = 3.98CNSVPAQPVINATDD126 pKa = 3.42NCSATGNITITRR138 pKa = 11.84NEE140 pKa = 3.45VRR142 pKa = 11.84TNGTCANTYY151 pKa = 8.84TLTRR155 pKa = 11.84TWTAVDD161 pKa = 3.25EE162 pKa = 4.86CGNDD166 pKa = 3.16TTIRR170 pKa = 11.84QIIHH174 pKa = 5.59VQDD177 pKa = 3.16TAAPVFSVVIPADD190 pKa = 3.47TTVDD194 pKa = 3.97CNSVPAQAVITATDD208 pKa = 3.33NCSATGNITITRR220 pKa = 11.84NEE222 pKa = 3.45VRR224 pKa = 11.84TNGTCANSYY233 pKa = 8.89TLTRR237 pKa = 11.84TWTAVDD243 pKa = 3.25EE244 pKa = 4.86CGNDD248 pKa = 3.34TTITQVVHH256 pKa = 5.9VQDD259 pKa = 3.33TTAPVVTTVIPAARR273 pKa = 11.84TVDD276 pKa = 3.7CDD278 pKa = 3.45AVPVQEE284 pKa = 6.18DD285 pKa = 3.08ITATDD290 pKa = 3.14NCSAVPNISVVKK302 pKa = 10.94NEE304 pKa = 3.25VRR306 pKa = 11.84TNGACANTYY315 pKa = 8.82TLTRR319 pKa = 11.84TWVVSDD325 pKa = 3.29EE326 pKa = 4.65CGNDD330 pKa = 3.31TTITQVLTVQDD341 pKa = 3.42TTAPVVTVVIPATRR355 pKa = 11.84TVDD358 pKa = 3.41CDD360 pKa = 3.36AVPVQEE366 pKa = 6.18DD367 pKa = 3.17ITATDD372 pKa = 3.15NN373 pKa = 3.56
NN1 pKa = 7.68DD2 pKa = 3.29TTITQVIHH10 pKa = 5.98VQDD13 pKa = 3.28TTAPVFAVAAPADD26 pKa = 3.88TTVDD30 pKa = 3.98CNSVPAQPVITATDD44 pKa = 3.54NCSVTPNITVTRR56 pKa = 11.84NEE58 pKa = 3.4VRR60 pKa = 11.84TNGTCANSYY69 pKa = 10.4ILTRR73 pKa = 11.84TWTATDD79 pKa = 3.12EE80 pKa = 4.66CGNDD84 pKa = 3.29TTITQVIHH92 pKa = 5.86VQDD95 pKa = 3.75TVAPRR100 pKa = 11.84FNAIAPADD108 pKa = 3.83TTVDD112 pKa = 3.98CNSVPAQPVINATDD126 pKa = 3.42NCSATGNITITRR138 pKa = 11.84NEE140 pKa = 3.45VRR142 pKa = 11.84TNGTCANTYY151 pKa = 8.84TLTRR155 pKa = 11.84TWTAVDD161 pKa = 3.25EE162 pKa = 4.86CGNDD166 pKa = 3.16TTIRR170 pKa = 11.84QIIHH174 pKa = 5.59VQDD177 pKa = 3.16TAAPVFSVVIPADD190 pKa = 3.47TTVDD194 pKa = 3.97CNSVPAQAVITATDD208 pKa = 3.33NCSATGNITITRR220 pKa = 11.84NEE222 pKa = 3.45VRR224 pKa = 11.84TNGTCANSYY233 pKa = 8.89TLTRR237 pKa = 11.84TWTAVDD243 pKa = 3.25EE244 pKa = 4.86CGNDD248 pKa = 3.34TTITQVVHH256 pKa = 5.9VQDD259 pKa = 3.33TTAPVVTTVIPAARR273 pKa = 11.84TVDD276 pKa = 3.7CDD278 pKa = 3.45AVPVQEE284 pKa = 6.18DD285 pKa = 3.08ITATDD290 pKa = 3.14NCSAVPNISVVKK302 pKa = 10.94NEE304 pKa = 3.25VRR306 pKa = 11.84TNGACANTYY315 pKa = 8.82TLTRR319 pKa = 11.84TWVVSDD325 pKa = 3.29EE326 pKa = 4.65CGNDD330 pKa = 3.31TTITQVLTVQDD341 pKa = 3.42TTAPVVTVVIPATRR355 pKa = 11.84TVDD358 pKa = 3.41CDD360 pKa = 3.36AVPVQEE366 pKa = 6.18DD367 pKa = 3.17ITATDD372 pKa = 3.15NN373 pKa = 3.56
Molecular weight: 39.42 kDa
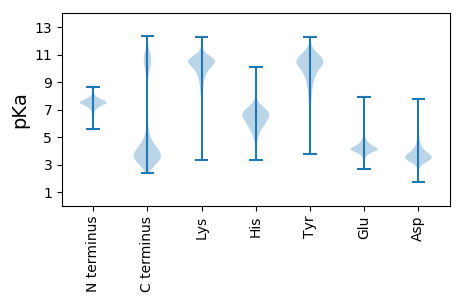
Isoelectric point according different methods:
Protein with the highest isoelectric point:
>tr|A0A1N6DP39|A0A1N6DP39_9BACT Glucose-1-phosphate adenylyltransferase OS=Chitinophaga niabensis OX=536979 GN=SAMN04488055_0952 PE=3 SV=1
MM1 pKa = 7.6VLIMNWLVLGIILACLNALTLAKK24 pKa = 9.95FYY26 pKa = 11.45NPDD29 pKa = 3.39NPKK32 pKa = 11.35DD33 pKa = 3.52MIATVRR39 pKa = 11.84AKK41 pKa = 10.2IAEE44 pKa = 4.27TTLRR48 pKa = 11.84AWFYY52 pKa = 11.04FWLTSLRR59 pKa = 11.84SVSRR63 pKa = 11.84ISFSRR68 pKa = 11.84KK69 pKa = 7.92GLRR72 pKa = 11.84II73 pKa = 3.63
MM1 pKa = 7.6VLIMNWLVLGIILACLNALTLAKK24 pKa = 9.95FYY26 pKa = 11.45NPDD29 pKa = 3.39NPKK32 pKa = 11.35DD33 pKa = 3.52MIATVRR39 pKa = 11.84AKK41 pKa = 10.2IAEE44 pKa = 4.27TTLRR48 pKa = 11.84AWFYY52 pKa = 11.04FWLTSLRR59 pKa = 11.84SVSRR63 pKa = 11.84ISFSRR68 pKa = 11.84KK69 pKa = 7.92GLRR72 pKa = 11.84II73 pKa = 3.63
Molecular weight: 8.43 kDa
Isoelectric point according different methods:
Peptides (in silico digests for buttom-up proteomics)
Below you can find in silico digests of the whole proteome with Trypsin, Chymotrypsin, Trypsin+LysC, LysN, ArgC proteases suitable for different mass spec machines.| Try ESI |
 |
|---|
| ChTry ESI |
 |
|---|
| ArgC ESI |
 |
|---|
| LysN ESI |
 |
|---|
| TryLysC ESI |
 |
|---|
| Try MALDI |
 |
|---|
| ChTry MALDI |
 |
|---|
| ArgC MALDI |
 |
|---|
| LysN MALDI |
 |
|---|
| TryLysC MALDI |
 |
|---|
| Try LTQ |
 |
|---|
| ChTry LTQ |
 |
|---|
| ArgC LTQ |
 |
|---|
| LysN LTQ |
 |
|---|
| TryLysC LTQ |
 |
|---|
| Try MSlow |
 |
|---|
| ChTry MSlow |
 |
|---|
| ArgC MSlow |
 |
|---|
| LysN MSlow |
 |
|---|
| TryLysC MSlow |
 |
|---|
| Try MShigh |
 |
|---|
| ChTry MShigh |
 |
|---|
| ArgC MShigh |
 |
|---|
| LysN MShigh |
 |
|---|
| TryLysC MShigh |
 |
|---|
General Statistics
Number of major isoforms |
Number of additional isoforms |
Number of all proteins |
Number of amino acids |
Min. Seq. Length |
Max. Seq. Length |
Avg. Seq. Length |
Avg. Mol. Weight |
|---|---|---|---|---|---|---|---|
0 |
2185197 |
27 |
8665 |
378.5 |
42.34 |
Amino acid frequency
Ala |
Cys |
Asp |
Glu |
Phe |
Gly |
His |
Ile |
Lys |
Leu |
|---|---|---|---|---|---|---|---|---|---|
8.015 ± 0.038 | 0.784 ± 0.012 |
5.126 ± 0.02 | 5.541 ± 0.033 |
4.725 ± 0.024 | 7.198 ± 0.031 |
1.883 ± 0.017 | 6.632 ± 0.024 |
6.386 ± 0.037 | 9.413 ± 0.043 |
Met |
Asn |
Gln |
Pro |
Arg |
Ser |
Thr |
Val |
Trp |
Tyr |
|---|---|---|---|---|---|---|---|---|---|
2.416 ± 0.016 | 5.289 ± 0.031 |
4.21 ± 0.02 | 3.868 ± 0.02 |
4.48 ± 0.021 | 6.038 ± 0.027 |
6.045 ± 0.053 | 6.464 ± 0.028 |
1.357 ± 0.014 | 4.13 ± 0.024 |
Most of the basic statistics you can see at this page can be downloaded from this CSV file
Proteome-pI is available under Creative Commons Attribution-NoDerivs license, for more details see here
| Reference: Kozlowski LP. Proteome-pI 2.0: Proteome Isoelectric Point Database Update. Nucleic Acids Res. 2021, doi: 10.1093/nar/gkab944 | Contact: Lukasz P. Kozlowski |
