Nocardioides szechwanensis
Taxonomy: cellular organisms; Bacteria; Terrabacteria group; Actinobacteria; Actinomycetia; Propionibacteriales; Nocardioidaceae; Nocardioides
Average proteome isoelectric point is 5.79
Get precalculated fractions of proteins

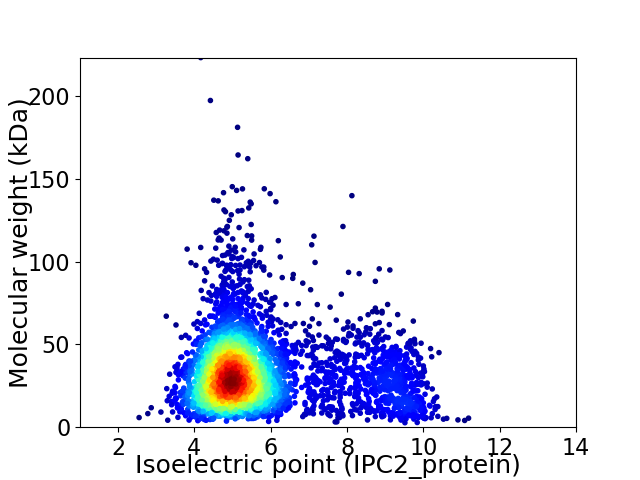
Virtual 2D-PAGE plot for 4039 proteins (isoelectric point calculated using IPC2_protein)
Get csv file with sequences according to given criteria:
* You can choose from 21 different methods for calculating isoelectric point
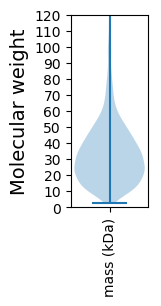
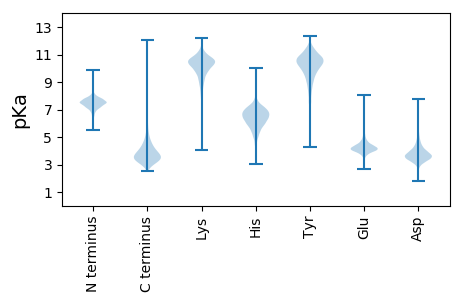
Summary statistics related to proteome-wise predictions


Protein with the lowest isoelectric point:
>tr|A0A1H0CHA8|A0A1H0CHA8_9ACTN Putative Holin-X holin superfamily III OS=Nocardioides szechwanensis OX=1005944 GN=SAMN05192576_2425 PE=4 SV=1
MM1 pKa = 7.92RR2 pKa = 11.84RR3 pKa = 11.84QLQFAAVAATCLAAGACGSDD23 pKa = 3.84EE24 pKa = 4.53EE25 pKa = 4.71PVAAADD31 pKa = 4.63DD32 pKa = 4.56APSHH36 pKa = 6.37NLTAHH41 pKa = 6.94PALPDD46 pKa = 3.95APHH49 pKa = 5.79WTYY52 pKa = 11.78DD53 pKa = 3.68EE54 pKa = 4.37APEE57 pKa = 4.33WGDD60 pKa = 4.61LDD62 pKa = 3.84EE63 pKa = 5.66QYY65 pKa = 11.12AACGTGEE72 pKa = 4.07RR73 pKa = 11.84QSPVDD78 pKa = 3.51LAGAADD84 pKa = 4.62EE85 pKa = 5.39DD86 pKa = 4.41LADD89 pKa = 4.5PVLDD93 pKa = 3.75YY94 pKa = 11.38QPFEE98 pKa = 4.25LTVTDD103 pKa = 4.0TDD105 pKa = 3.46HH106 pKa = 7.07SIQVGYY112 pKa = 8.13EE113 pKa = 3.86TGSTLTLDD121 pKa = 3.66DD122 pKa = 3.8AAYY125 pKa = 10.32EE126 pKa = 3.9LVQLHH131 pKa = 5.6FHH133 pKa = 6.76APSEE137 pKa = 4.15HH138 pKa = 6.48TIDD141 pKa = 4.09GKK143 pKa = 9.94PAAAEE148 pKa = 3.61IHH150 pKa = 6.13FVHH153 pKa = 7.08GDD155 pKa = 3.07HH156 pKa = 7.66DD157 pKa = 4.5GPFVVLGVLVEE168 pKa = 4.32EE169 pKa = 5.39GPPEE173 pKa = 3.88AAMNDD178 pKa = 3.94VLDD181 pKa = 4.45HH182 pKa = 6.62LPVGTGDD189 pKa = 3.58ADD191 pKa = 3.41AGTFFDD197 pKa = 5.04AAEE200 pKa = 4.56LLPDD204 pKa = 3.35SLTAYY209 pKa = 9.91RR210 pKa = 11.84YY211 pKa = 8.79EE212 pKa = 4.65GSLTTPPCTEE222 pKa = 3.81DD223 pKa = 3.57VTWLVLDD230 pKa = 4.93EE231 pKa = 4.38PVTWSAEE238 pKa = 3.69QLARR242 pKa = 11.84LTARR246 pKa = 11.84YY247 pKa = 8.17DD248 pKa = 3.46ANSRR252 pKa = 11.84PLQDD256 pKa = 3.34LHH258 pKa = 8.48DD259 pKa = 5.37RR260 pKa = 11.84DD261 pKa = 4.68LLLDD265 pKa = 3.46QDD267 pKa = 3.99
MM1 pKa = 7.92RR2 pKa = 11.84RR3 pKa = 11.84QLQFAAVAATCLAAGACGSDD23 pKa = 3.84EE24 pKa = 4.53EE25 pKa = 4.71PVAAADD31 pKa = 4.63DD32 pKa = 4.56APSHH36 pKa = 6.37NLTAHH41 pKa = 6.94PALPDD46 pKa = 3.95APHH49 pKa = 5.79WTYY52 pKa = 11.78DD53 pKa = 3.68EE54 pKa = 4.37APEE57 pKa = 4.33WGDD60 pKa = 4.61LDD62 pKa = 3.84EE63 pKa = 5.66QYY65 pKa = 11.12AACGTGEE72 pKa = 4.07RR73 pKa = 11.84QSPVDD78 pKa = 3.51LAGAADD84 pKa = 4.62EE85 pKa = 5.39DD86 pKa = 4.41LADD89 pKa = 4.5PVLDD93 pKa = 3.75YY94 pKa = 11.38QPFEE98 pKa = 4.25LTVTDD103 pKa = 4.0TDD105 pKa = 3.46HH106 pKa = 7.07SIQVGYY112 pKa = 8.13EE113 pKa = 3.86TGSTLTLDD121 pKa = 3.66DD122 pKa = 3.8AAYY125 pKa = 10.32EE126 pKa = 3.9LVQLHH131 pKa = 5.6FHH133 pKa = 6.76APSEE137 pKa = 4.15HH138 pKa = 6.48TIDD141 pKa = 4.09GKK143 pKa = 9.94PAAAEE148 pKa = 3.61IHH150 pKa = 6.13FVHH153 pKa = 7.08GDD155 pKa = 3.07HH156 pKa = 7.66DD157 pKa = 4.5GPFVVLGVLVEE168 pKa = 4.32EE169 pKa = 5.39GPPEE173 pKa = 3.88AAMNDD178 pKa = 3.94VLDD181 pKa = 4.45HH182 pKa = 6.62LPVGTGDD189 pKa = 3.58ADD191 pKa = 3.41AGTFFDD197 pKa = 5.04AAEE200 pKa = 4.56LLPDD204 pKa = 3.35SLTAYY209 pKa = 9.91RR210 pKa = 11.84YY211 pKa = 8.79EE212 pKa = 4.65GSLTTPPCTEE222 pKa = 3.81DD223 pKa = 3.57VTWLVLDD230 pKa = 4.93EE231 pKa = 4.38PVTWSAEE238 pKa = 3.69QLARR242 pKa = 11.84LTARR246 pKa = 11.84YY247 pKa = 8.17DD248 pKa = 3.46ANSRR252 pKa = 11.84PLQDD256 pKa = 3.34LHH258 pKa = 8.48DD259 pKa = 5.37RR260 pKa = 11.84DD261 pKa = 4.68LLLDD265 pKa = 3.46QDD267 pKa = 3.99
Molecular weight: 28.73 kDa
Isoelectric point according different methods:
Protein with the highest isoelectric point:
>tr|A0A1H0BYT2|A0A1H0BYT2_9ACTN UDP-glucose 4-epimerase OS=Nocardioides szechwanensis OX=1005944 GN=SAMN05192576_2273 PE=4 SV=1
MM1 pKa = 7.4GSVIKK6 pKa = 10.42KK7 pKa = 8.47RR8 pKa = 11.84RR9 pKa = 11.84KK10 pKa = 9.22RR11 pKa = 11.84MAKK14 pKa = 9.41KK15 pKa = 9.99KK16 pKa = 9.77HH17 pKa = 5.81RR18 pKa = 11.84KK19 pKa = 8.51LLKK22 pKa = 8.15KK23 pKa = 9.24TRR25 pKa = 11.84VQRR28 pKa = 11.84RR29 pKa = 11.84KK30 pKa = 10.07LGKK33 pKa = 9.87
MM1 pKa = 7.4GSVIKK6 pKa = 10.42KK7 pKa = 8.47RR8 pKa = 11.84RR9 pKa = 11.84KK10 pKa = 9.22RR11 pKa = 11.84MAKK14 pKa = 9.41KK15 pKa = 9.99KK16 pKa = 9.77HH17 pKa = 5.81RR18 pKa = 11.84KK19 pKa = 8.51LLKK22 pKa = 8.15KK23 pKa = 9.24TRR25 pKa = 11.84VQRR28 pKa = 11.84RR29 pKa = 11.84KK30 pKa = 10.07LGKK33 pKa = 9.87
Molecular weight: 4.07 kDa
Isoelectric point according different methods:
Peptides (in silico digests for buttom-up proteomics)
Below you can find in silico digests of the whole proteome with Trypsin, Chymotrypsin, Trypsin+LysC, LysN, ArgC proteases suitable for different mass spec machines.| Try ESI |
 |
|---|
| ChTry ESI |
 |
|---|
| ArgC ESI |
 |
|---|
| LysN ESI |
 |
|---|
| TryLysC ESI |
 |
|---|
| Try MALDI |
 |
|---|
| ChTry MALDI |
 |
|---|
| ArgC MALDI |
 |
|---|
| LysN MALDI |
 |
|---|
| TryLysC MALDI |
 |
|---|
| Try LTQ |
 |
|---|
| ChTry LTQ |
 |
|---|
| ArgC LTQ |
 |
|---|
| LysN LTQ |
 |
|---|
| TryLysC LTQ |
 |
|---|
| Try MSlow |
 |
|---|
| ChTry MSlow |
 |
|---|
| ArgC MSlow |
 |
|---|
| LysN MSlow |
 |
|---|
| TryLysC MSlow |
 |
|---|
| Try MShigh |
 |
|---|
| ChTry MShigh |
 |
|---|
| ArgC MShigh |
 |
|---|
| LysN MShigh |
 |
|---|
| TryLysC MShigh |
 |
|---|
General Statistics
Number of major isoforms |
Number of additional isoforms |
Number of all proteins |
Number of amino acids |
Min. Seq. Length |
Max. Seq. Length |
Avg. Seq. Length |
Avg. Mol. Weight |
|---|---|---|---|---|---|---|---|
0 |
1303589 |
24 |
2147 |
322.8 |
34.6 |
Amino acid frequency
Ala |
Cys |
Asp |
Glu |
Phe |
Gly |
His |
Ile |
Lys |
Leu |
|---|---|---|---|---|---|---|---|---|---|
12.648 ± 0.052 | 0.746 ± 0.011 |
6.625 ± 0.034 | 5.817 ± 0.039 |
2.865 ± 0.024 | 9.143 ± 0.038 |
2.177 ± 0.019 | 3.553 ± 0.027 |
2.074 ± 0.025 | 10.309 ± 0.042 |
Met |
Asn |
Gln |
Pro |
Arg |
Ser |
Thr |
Val |
Trp |
Tyr |
|---|---|---|---|---|---|---|---|---|---|
1.907 ± 0.017 | 1.852 ± 0.02 |
5.606 ± 0.032 | 2.764 ± 0.017 |
7.319 ± 0.042 | 5.392 ± 0.022 |
6.242 ± 0.035 | 9.422 ± 0.036 |
1.512 ± 0.013 | 2.027 ± 0.017 |
Most of the basic statistics you can see at this page can be downloaded from this CSV file
Proteome-pI is available under Creative Commons Attribution-NoDerivs license, for more details see here
| Reference: Kozlowski LP. Proteome-pI 2.0: Proteome Isoelectric Point Database Update. Nucleic Acids Res. 2021, doi: 10.1093/nar/gkab944 | Contact: Lukasz P. Kozlowski |
