Streptococcus phage phi-SsuFJZZ39_rum
Taxonomy: Viruses; Duplodnaviria; Heunggongvirae; Uroviricota; Caudoviricetes; Caudovirales; Siphoviridae; unclassified Siphoviridae
Average proteome isoelectric point is 6.19
Get precalculated fractions of proteins

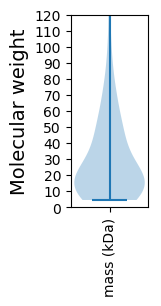
Virtual 2D-PAGE plot for 79 proteins (isoelectric point calculated using IPC2_protein)
Get csv file with sequences according to given criteria:
* You can choose from 21 different methods for calculating isoelectric point
Summary statistics related to proteome-wise predictions

Protein with the lowest isoelectric point:
>tr|A0A7G3MJG0|A0A7G3MJG0_9CAUD Uncharacterized protein OS=Streptococcus phage phi-SsuFJZZ39_rum OX=2664397 PE=4 SV=1
MM1 pKa = 7.55NDD3 pKa = 4.25EE4 pKa = 4.47INLDD8 pKa = 4.15KK9 pKa = 10.9IVLTAIEE16 pKa = 4.56TEE18 pKa = 4.53MKK20 pKa = 10.02CKK22 pKa = 10.42NYY24 pKa = 10.72LMLKK28 pKa = 9.49SHH30 pKa = 7.39GIDD33 pKa = 3.32IISDD37 pKa = 3.63YY38 pKa = 11.14YY39 pKa = 11.4YY40 pKa = 10.68VDD42 pKa = 3.32EE43 pKa = 5.2DD44 pKa = 3.92FAVITFSRR52 pKa = 11.84NEE54 pKa = 3.94DD55 pKa = 3.07KK56 pKa = 9.03MTIRR60 pKa = 11.84VEE62 pKa = 3.96NQEE65 pKa = 4.84CIVCVEE71 pKa = 3.93NHH73 pKa = 4.89VVKK76 pKa = 10.85AFEE79 pKa = 4.3SFLEE83 pKa = 4.65GEE85 pKa = 5.13DD86 pKa = 3.59IDD88 pKa = 4.27DD89 pKa = 4.71QIEE92 pKa = 4.0ILIKK96 pKa = 9.26QLCIGKK102 pKa = 8.17WQIFIEE108 pKa = 4.4DD109 pKa = 3.6VANNSLVDD117 pKa = 4.85AIQKK121 pKa = 10.32HH122 pKa = 5.36GFDD125 pKa = 5.13DD126 pKa = 4.3YY127 pKa = 11.97SNGPDD132 pKa = 3.45AIIYY136 pKa = 7.4FF137 pKa = 4.24
MM1 pKa = 7.55NDD3 pKa = 4.25EE4 pKa = 4.47INLDD8 pKa = 4.15KK9 pKa = 10.9IVLTAIEE16 pKa = 4.56TEE18 pKa = 4.53MKK20 pKa = 10.02CKK22 pKa = 10.42NYY24 pKa = 10.72LMLKK28 pKa = 9.49SHH30 pKa = 7.39GIDD33 pKa = 3.32IISDD37 pKa = 3.63YY38 pKa = 11.14YY39 pKa = 11.4YY40 pKa = 10.68VDD42 pKa = 3.32EE43 pKa = 5.2DD44 pKa = 3.92FAVITFSRR52 pKa = 11.84NEE54 pKa = 3.94DD55 pKa = 3.07KK56 pKa = 9.03MTIRR60 pKa = 11.84VEE62 pKa = 3.96NQEE65 pKa = 4.84CIVCVEE71 pKa = 3.93NHH73 pKa = 4.89VVKK76 pKa = 10.85AFEE79 pKa = 4.3SFLEE83 pKa = 4.65GEE85 pKa = 5.13DD86 pKa = 3.59IDD88 pKa = 4.27DD89 pKa = 4.71QIEE92 pKa = 4.0ILIKK96 pKa = 9.26QLCIGKK102 pKa = 8.17WQIFIEE108 pKa = 4.4DD109 pKa = 3.6VANNSLVDD117 pKa = 4.85AIQKK121 pKa = 10.32HH122 pKa = 5.36GFDD125 pKa = 5.13DD126 pKa = 4.3YY127 pKa = 11.97SNGPDD132 pKa = 3.45AIIYY136 pKa = 7.4FF137 pKa = 4.24
Molecular weight: 15.88 kDa
Isoelectric point according different methods:
Protein with the highest isoelectric point:
>tr|A0A7G3MJC1|A0A7G3MJC1_9CAUD Terminase small subunit OS=Streptococcus phage phi-SsuFJZZ39_rum OX=2664397 PE=4 SV=1
MM1 pKa = 7.74PRR3 pKa = 11.84RR4 pKa = 11.84PSTPCKK10 pKa = 10.41QNGCPNLVPYY20 pKa = 8.51GQKK23 pKa = 9.9YY24 pKa = 8.86CANHH28 pKa = 6.26KK29 pKa = 10.31VNHH32 pKa = 5.75QLDD35 pKa = 3.96AKK37 pKa = 8.2STKK40 pKa = 10.13AKK42 pKa = 10.15GYY44 pKa = 9.42NGQWTKK50 pKa = 11.25ARR52 pKa = 11.84LRR54 pKa = 11.84YY55 pKa = 10.0LKK57 pKa = 9.81VHH59 pKa = 6.46PLCVQCKK66 pKa = 9.75AKK68 pKa = 10.52GRR70 pKa = 11.84LTKK73 pKa = 10.1ATVVDD78 pKa = 5.28HH79 pKa = 6.23ITPHH83 pKa = 6.97RR84 pKa = 11.84GDD86 pKa = 5.06QEE88 pKa = 5.0LFWNQTNWQALCKK101 pKa = 9.93SCHH104 pKa = 5.64DD105 pKa = 4.22RR106 pKa = 11.84KK107 pKa = 8.93TKK109 pKa = 8.13TTDD112 pKa = 2.58RR113 pKa = 11.84YY114 pKa = 10.6VEE116 pKa = 3.73YY117 pKa = 9.41TYY119 pKa = 11.18RR120 pKa = 11.84FF121 pKa = 3.55
MM1 pKa = 7.74PRR3 pKa = 11.84RR4 pKa = 11.84PSTPCKK10 pKa = 10.41QNGCPNLVPYY20 pKa = 8.51GQKK23 pKa = 9.9YY24 pKa = 8.86CANHH28 pKa = 6.26KK29 pKa = 10.31VNHH32 pKa = 5.75QLDD35 pKa = 3.96AKK37 pKa = 8.2STKK40 pKa = 10.13AKK42 pKa = 10.15GYY44 pKa = 9.42NGQWTKK50 pKa = 11.25ARR52 pKa = 11.84LRR54 pKa = 11.84YY55 pKa = 10.0LKK57 pKa = 9.81VHH59 pKa = 6.46PLCVQCKK66 pKa = 9.75AKK68 pKa = 10.52GRR70 pKa = 11.84LTKK73 pKa = 10.1ATVVDD78 pKa = 5.28HH79 pKa = 6.23ITPHH83 pKa = 6.97RR84 pKa = 11.84GDD86 pKa = 5.06QEE88 pKa = 5.0LFWNQTNWQALCKK101 pKa = 9.93SCHH104 pKa = 5.64DD105 pKa = 4.22RR106 pKa = 11.84KK107 pKa = 8.93TKK109 pKa = 8.13TTDD112 pKa = 2.58RR113 pKa = 11.84YY114 pKa = 10.6VEE116 pKa = 3.73YY117 pKa = 9.41TYY119 pKa = 11.18RR120 pKa = 11.84FF121 pKa = 3.55
Molecular weight: 14.15 kDa
Isoelectric point according different methods:
Peptides (in silico digests for buttom-up proteomics)
Below you can find in silico digests of the whole proteome with Trypsin, Chymotrypsin, Trypsin+LysC, LysN, ArgC proteases suitable for different mass spec machines.| Try ESI |
 |
|---|
| ChTry ESI |
|
|---|
| ArgC ESI |
|
|---|
| LysN ESI |
|
|---|
| TryLysC ESI |
|
|---|
| Try MALDI |
|
|---|
| ChTry MALDI |
|
|---|
| ArgC MALDI |
|
|---|
| LysN MALDI |
|
|---|
| TryLysC MALDI |
|
|---|
| Try LTQ |
|
|---|
| ChTry LTQ |
|
|---|
| ArgC LTQ |
|
|---|
| LysN LTQ |
|
|---|
| TryLysC LTQ |
|
|---|
| Try MSlow |
|
|---|
| ChTry MSlow |
|
|---|
| ArgC MSlow |
|
|---|
| LysN MSlow |
|
|---|
| TryLysC MSlow |
|
|---|
| Try MShigh |
|
|---|
| ChTry MShigh |
|
|---|
| ArgC MShigh |
|
|---|
| LysN MShigh |
|
|---|
| TryLysC MShigh |
|
|---|
General Statistics
Number of major isoforms |
Number of additional isoforms |
Number of all proteins |
Number of amino acids |
Min. Seq. Length |
Max. Seq. Length |
Avg. Seq. Length |
Avg. Mol. Weight |
|---|---|---|---|---|---|---|---|
0 |
22191 |
39 |
1515 |
280.9 |
31.85 |
Amino acid frequency
Ala |
Cys |
Asp |
Glu |
Phe |
Gly |
His |
Ile |
Lys |
Leu |
|---|---|---|---|---|---|---|---|---|---|
7.034 ± 0.691 | 0.816 ± 0.112 |
5.795 ± 0.252 | 7.809 ± 0.371 |
4.006 ± 0.286 | 5.768 ± 0.261 |
1.766 ± 0.099 | 6.823 ± 0.296 |
7.674 ± 0.251 | 9.067 ± 0.225 |
Met |
Asn |
Gln |
Pro |
Arg |
Ser |
Thr |
Val |
Trp |
Tyr |
|---|---|---|---|---|---|---|---|---|---|
2.217 ± 0.136 | 5.408 ± 0.22 |
2.771 ± 0.146 | 4.538 ± 0.227 |
4.592 ± 0.168 | 6.624 ± 0.247 |
6.147 ± 0.397 | 6.102 ± 0.173 |
1.176 ± 0.102 | 3.866 ± 0.26 |
Most of the basic statistics you can see at this page can be downloaded from this CSV file
See this proteome in:

Proteome-pI is available under Creative Commons Attribution-NoDerivs license, for more details see here
| Reference: Kozlowski LP. Proteome-pI 2.0: Proteome Isoelectric Point Database Update. Nucleic Acids Res. 2021, doi: 10.1093/nar/gkab944 | Contact: Lukasz P. Kozlowski |