Hyphomonas pacifica
Taxonomy: cellular organisms; Bacteria; Proteobacteria; Alphaproteobacteria; Hyphomonadales; Hyphomonadaceae; Hyphomonas
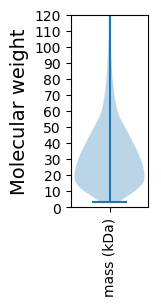
Average proteome isoelectric point is 5.98
Get precalculated fractions of proteins

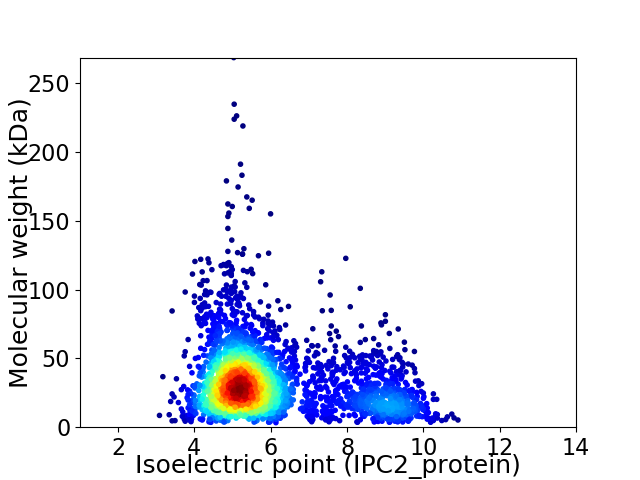
Virtual 2D-PAGE plot for 3301 proteins (isoelectric point calculated using IPC2_protein)
Get csv file with sequences according to given criteria:
* You can choose from 21 different methods for calculating isoelectric point
Summary statistics related to proteome-wise predictions


Protein with the lowest isoelectric point:
>tr|A0A062U1F5|A0A062U1F5_9PROT Uncharacterized protein OS=Hyphomonas pacifica OX=1280941 GN=HY11_03775 PE=4 SV=1
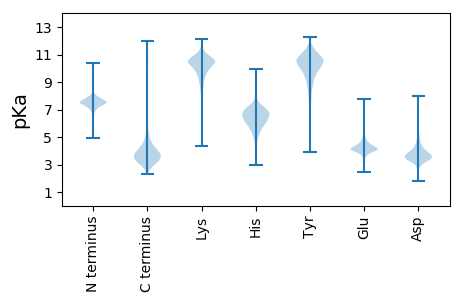
MM1 pKa = 7.29RR2 pKa = 11.84RR3 pKa = 11.84GWILAAAGLLAACGEE18 pKa = 4.39RR19 pKa = 11.84VEE21 pKa = 5.11EE22 pKa = 4.09PVEE25 pKa = 3.93PDD27 pKa = 3.23VTVVEE32 pKa = 4.54APDD35 pKa = 4.91PIEE38 pKa = 4.38TPAEE42 pKa = 3.85IAKK45 pKa = 10.41SDD47 pKa = 4.05GEE49 pKa = 4.1TDD51 pKa = 3.62YY52 pKa = 11.45QAVSGYY58 pKa = 10.89GEE60 pKa = 4.16GWYY63 pKa = 10.33VSPGWPGEE71 pKa = 4.16YY72 pKa = 9.43PAGFAVLDD80 pKa = 4.06PGVVVNGWSQPNSGVPADD98 pKa = 4.79LEE100 pKa = 4.61CPLPQYY106 pKa = 11.59ANYY109 pKa = 9.87QLWNRR114 pKa = 11.84DD115 pKa = 3.24RR116 pKa = 11.84VEE118 pKa = 4.98KK119 pKa = 10.65DD120 pKa = 3.14DD121 pKa = 5.55LDD123 pKa = 4.06FFVATKK129 pKa = 8.42TFPVTLSQDD138 pKa = 2.8ASIEE142 pKa = 4.25YY143 pKa = 10.74VSDD146 pKa = 3.46TGIKK150 pKa = 9.28TLDD153 pKa = 4.12LKK155 pKa = 10.42TGDD158 pKa = 3.16QLTYY162 pKa = 10.8LRR164 pKa = 11.84YY165 pKa = 9.86LGEE168 pKa = 4.25GFTIVSFGGEE178 pKa = 3.68EE179 pKa = 3.92YY180 pKa = 10.59DD181 pKa = 3.76INEE184 pKa = 4.14AEE186 pKa = 4.41LRR188 pKa = 11.84EE189 pKa = 3.97ISDD192 pKa = 3.48ISSLPAPTEE201 pKa = 4.08DD202 pKa = 2.4QWVNVEE208 pKa = 4.5CEE210 pKa = 4.12DD211 pKa = 5.05GSRR214 pKa = 11.84AWLLYY219 pKa = 9.65STMVDD224 pKa = 3.37LPGVVASPIMGYY236 pKa = 10.91GEE238 pKa = 4.72ASDD241 pKa = 3.95IAPDD245 pKa = 3.57DD246 pKa = 3.83VAEE249 pKa = 4.34VRR251 pKa = 11.84AGAAAMANAYY261 pKa = 9.85EE262 pKa = 4.8GIEE265 pKa = 4.19PEE267 pKa = 4.35AALPDD272 pKa = 3.75QEE274 pKa = 4.33
MM1 pKa = 7.29RR2 pKa = 11.84RR3 pKa = 11.84GWILAAAGLLAACGEE18 pKa = 4.39RR19 pKa = 11.84VEE21 pKa = 5.11EE22 pKa = 4.09PVEE25 pKa = 3.93PDD27 pKa = 3.23VTVVEE32 pKa = 4.54APDD35 pKa = 4.91PIEE38 pKa = 4.38TPAEE42 pKa = 3.85IAKK45 pKa = 10.41SDD47 pKa = 4.05GEE49 pKa = 4.1TDD51 pKa = 3.62YY52 pKa = 11.45QAVSGYY58 pKa = 10.89GEE60 pKa = 4.16GWYY63 pKa = 10.33VSPGWPGEE71 pKa = 4.16YY72 pKa = 9.43PAGFAVLDD80 pKa = 4.06PGVVVNGWSQPNSGVPADD98 pKa = 4.79LEE100 pKa = 4.61CPLPQYY106 pKa = 11.59ANYY109 pKa = 9.87QLWNRR114 pKa = 11.84DD115 pKa = 3.24RR116 pKa = 11.84VEE118 pKa = 4.98KK119 pKa = 10.65DD120 pKa = 3.14DD121 pKa = 5.55LDD123 pKa = 4.06FFVATKK129 pKa = 8.42TFPVTLSQDD138 pKa = 2.8ASIEE142 pKa = 4.25YY143 pKa = 10.74VSDD146 pKa = 3.46TGIKK150 pKa = 9.28TLDD153 pKa = 4.12LKK155 pKa = 10.42TGDD158 pKa = 3.16QLTYY162 pKa = 10.8LRR164 pKa = 11.84YY165 pKa = 9.86LGEE168 pKa = 4.25GFTIVSFGGEE178 pKa = 3.68EE179 pKa = 3.92YY180 pKa = 10.59DD181 pKa = 3.76INEE184 pKa = 4.14AEE186 pKa = 4.41LRR188 pKa = 11.84EE189 pKa = 3.97ISDD192 pKa = 3.48ISSLPAPTEE201 pKa = 4.08DD202 pKa = 2.4QWVNVEE208 pKa = 4.5CEE210 pKa = 4.12DD211 pKa = 5.05GSRR214 pKa = 11.84AWLLYY219 pKa = 9.65STMVDD224 pKa = 3.37LPGVVASPIMGYY236 pKa = 10.91GEE238 pKa = 4.72ASDD241 pKa = 3.95IAPDD245 pKa = 3.57DD246 pKa = 3.83VAEE249 pKa = 4.34VRR251 pKa = 11.84AGAAAMANAYY261 pKa = 9.85EE262 pKa = 4.8GIEE265 pKa = 4.19PEE267 pKa = 4.35AALPDD272 pKa = 3.75QEE274 pKa = 4.33
Molecular weight: 29.6 kDa
Isoelectric point according different methods:
Protein with the highest isoelectric point:
>tr|A0A062TZ82|A0A062TZ82_9PROT NADPH:quinone oxidoreductase OS=Hyphomonas pacifica OX=1280941 GN=HY11_10255 PE=4 SV=1
MM1 pKa = 7.45KK2 pKa = 9.61RR3 pKa = 11.84TFQPSNLRR11 pKa = 11.84RR12 pKa = 11.84KK13 pKa = 8.17RR14 pKa = 11.84THH16 pKa = 5.98GFRR19 pKa = 11.84DD20 pKa = 3.34RR21 pKa = 11.84MSTKK25 pKa = 10.29NGRR28 pKa = 11.84KK29 pKa = 8.58VLARR33 pKa = 11.84RR34 pKa = 11.84RR35 pKa = 11.84AKK37 pKa = 10.15GRR39 pKa = 11.84KK40 pKa = 8.87SLSAA44 pKa = 3.86
MM1 pKa = 7.45KK2 pKa = 9.61RR3 pKa = 11.84TFQPSNLRR11 pKa = 11.84RR12 pKa = 11.84KK13 pKa = 8.17RR14 pKa = 11.84THH16 pKa = 5.98GFRR19 pKa = 11.84DD20 pKa = 3.34RR21 pKa = 11.84MSTKK25 pKa = 10.29NGRR28 pKa = 11.84KK29 pKa = 8.58VLARR33 pKa = 11.84RR34 pKa = 11.84RR35 pKa = 11.84AKK37 pKa = 10.15GRR39 pKa = 11.84KK40 pKa = 8.87SLSAA44 pKa = 3.86
Molecular weight: 5.24 kDa
Isoelectric point according different methods:
Peptides (in silico digests for buttom-up proteomics)
Below you can find in silico digests of the whole proteome with Trypsin, Chymotrypsin, Trypsin+LysC, LysN, ArgC proteases suitable for different mass spec machines.| Try ESI |
 |
|---|
| ChTry ESI |
 |
|---|
| ArgC ESI |
 |
|---|
| LysN ESI |
 |
|---|
| TryLysC ESI |
 |
|---|
| Try MALDI |
 |
|---|
| ChTry MALDI |
 |
|---|
| ArgC MALDI |
 |
|---|
| LysN MALDI |
 |
|---|
| TryLysC MALDI |
 |
|---|
| Try LTQ |
 |
|---|
| ChTry LTQ |
 |
|---|
| ArgC LTQ |
 |
|---|
| LysN LTQ |
 |
|---|
| TryLysC LTQ |
 |
|---|
| Try MSlow |
 |
|---|
| ChTry MSlow |
 |
|---|
| ArgC MSlow |
 |
|---|
| LysN MSlow |
 |
|---|
| TryLysC MSlow |
 |
|---|
| Try MShigh |
 |
|---|
| ChTry MShigh |
 |
|---|
| ArgC MShigh |
 |
|---|
| LysN MShigh |
 |
|---|
| TryLysC MShigh |
 |
|---|
General Statistics
Number of major isoforms |
Number of additional isoforms |
Number of all proteins |
Number of amino acids |
Min. Seq. Length |
Max. Seq. Length |
Avg. Seq. Length |
Avg. Mol. Weight |
|---|---|---|---|---|---|---|---|
0 |
1037903 |
29 |
2510 |
314.4 |
34.29 |
Amino acid frequency
Ala |
Cys |
Asp |
Glu |
Phe |
Gly |
His |
Ile |
Lys |
Leu |
|---|---|---|---|---|---|---|---|---|---|
11.651 ± 0.062 | 0.839 ± 0.015 |
6.189 ± 0.031 | 6.563 ± 0.043 |
3.669 ± 0.028 | 8.371 ± 0.042 |
1.929 ± 0.022 | 5.268 ± 0.034 |
3.829 ± 0.032 | 9.698 ± 0.042 |
Met |
Asn |
Gln |
Pro |
Arg |
Ser |
Thr |
Val |
Trp |
Tyr |
|---|---|---|---|---|---|---|---|---|---|
2.705 ± 0.023 | 2.776 ± 0.023 |
4.987 ± 0.029 | 3.227 ± 0.024 |
6.403 ± 0.044 | 5.739 ± 0.034 |
5.442 ± 0.032 | 6.881 ± 0.037 |
1.386 ± 0.019 | 2.444 ± 0.027 |
Most of the basic statistics you can see at this page can be downloaded from this CSV file
Proteome-pI is available under Creative Commons Attribution-NoDerivs license, for more details see here
| Reference: Kozlowski LP. Proteome-pI 2.0: Proteome Isoelectric Point Database Update. Nucleic Acids Res. 2021, doi: 10.1093/nar/gkab944 | Contact: Lukasz P. Kozlowski |
