Gordonia malaquae NBRC 108250
Taxonomy: cellular organisms; Bacteria; Terrabacteria group; Actinobacteria; Actinomycetia; Corynebacteriales; Gordoniaceae; Gordonia; Gordonia malaquae
Average proteome isoelectric point is 5.92
Get precalculated fractions of proteins

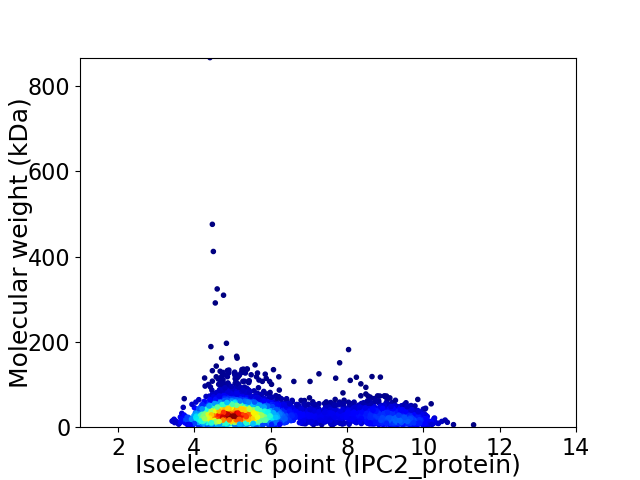
Virtual 2D-PAGE plot for 4269 proteins (isoelectric point calculated using IPC2_protein)
Get csv file with sequences according to given criteria:
* You can choose from 21 different methods for calculating isoelectric point
Summary statistics related to proteome-wise predictions


Protein with the lowest isoelectric point:
>tr|M3TBX3|M3TBX3_9ACTN Putative adenylate cyclase OS=Gordonia malaquae NBRC 108250 OX=1223542 GN=GM1_005_00890 PE=3 SV=1
MM1 pKa = 7.61NEE3 pKa = 3.89PLQPSVAITAPDD15 pKa = 3.88RR16 pKa = 11.84PRR18 pKa = 11.84AWIGSLAAYY27 pKa = 9.67NGSHH31 pKa = 7.22DD32 pKa = 3.97GVPRR36 pKa = 11.84LIGGWYY42 pKa = 9.67DD43 pKa = 2.99ATDD46 pKa = 3.57AVDD49 pKa = 3.44VTVADD54 pKa = 3.92LHH56 pKa = 7.01AGTGVPFTDD65 pKa = 4.48DD66 pKa = 3.59DD67 pKa = 3.94EE68 pKa = 6.72LYY70 pKa = 11.34VLDD73 pKa = 6.3LDD75 pKa = 5.34GEE77 pKa = 4.69WPVHH81 pKa = 6.85RR82 pKa = 11.84EE83 pKa = 3.65MDD85 pKa = 3.77PAEE88 pKa = 4.0AARR91 pKa = 11.84WGEE94 pKa = 3.83IYY96 pKa = 10.79EE97 pKa = 4.33EE98 pKa = 4.61VGATMWPALCAWVRR112 pKa = 11.84SGSYY116 pKa = 9.48VAEE119 pKa = 4.82GDD121 pKa = 2.75TDD123 pKa = 4.07YY124 pKa = 11.45PVIGDD129 pKa = 3.51FEE131 pKa = 4.06EE132 pKa = 5.87RR133 pKa = 11.84YY134 pKa = 10.33AGEE137 pKa = 3.88WDD139 pKa = 3.8SFDD142 pKa = 6.55DD143 pKa = 4.03YY144 pKa = 11.9AQDD147 pKa = 3.57LAEE150 pKa = 5.84GIGLLDD156 pKa = 3.87GVSDD160 pKa = 3.64EE161 pKa = 4.28VQRR164 pKa = 11.84YY165 pKa = 8.56FDD167 pKa = 3.44WASWTRR173 pKa = 11.84DD174 pKa = 2.98LRR176 pKa = 11.84YY177 pKa = 10.2DD178 pKa = 4.35YY179 pKa = 11.1SVQDD183 pKa = 4.03CPTGGVFVFRR193 pKa = 11.84DD194 pKa = 3.58TT195 pKa = 4.2
MM1 pKa = 7.61NEE3 pKa = 3.89PLQPSVAITAPDD15 pKa = 3.88RR16 pKa = 11.84PRR18 pKa = 11.84AWIGSLAAYY27 pKa = 9.67NGSHH31 pKa = 7.22DD32 pKa = 3.97GVPRR36 pKa = 11.84LIGGWYY42 pKa = 9.67DD43 pKa = 2.99ATDD46 pKa = 3.57AVDD49 pKa = 3.44VTVADD54 pKa = 3.92LHH56 pKa = 7.01AGTGVPFTDD65 pKa = 4.48DD66 pKa = 3.59DD67 pKa = 3.94EE68 pKa = 6.72LYY70 pKa = 11.34VLDD73 pKa = 6.3LDD75 pKa = 5.34GEE77 pKa = 4.69WPVHH81 pKa = 6.85RR82 pKa = 11.84EE83 pKa = 3.65MDD85 pKa = 3.77PAEE88 pKa = 4.0AARR91 pKa = 11.84WGEE94 pKa = 3.83IYY96 pKa = 10.79EE97 pKa = 4.33EE98 pKa = 4.61VGATMWPALCAWVRR112 pKa = 11.84SGSYY116 pKa = 9.48VAEE119 pKa = 4.82GDD121 pKa = 2.75TDD123 pKa = 4.07YY124 pKa = 11.45PVIGDD129 pKa = 3.51FEE131 pKa = 4.06EE132 pKa = 5.87RR133 pKa = 11.84YY134 pKa = 10.33AGEE137 pKa = 3.88WDD139 pKa = 3.8SFDD142 pKa = 6.55DD143 pKa = 4.03YY144 pKa = 11.9AQDD147 pKa = 3.57LAEE150 pKa = 5.84GIGLLDD156 pKa = 3.87GVSDD160 pKa = 3.64EE161 pKa = 4.28VQRR164 pKa = 11.84YY165 pKa = 8.56FDD167 pKa = 3.44WASWTRR173 pKa = 11.84DD174 pKa = 2.98LRR176 pKa = 11.84YY177 pKa = 10.2DD178 pKa = 4.35YY179 pKa = 11.1SVQDD183 pKa = 4.03CPTGGVFVFRR193 pKa = 11.84DD194 pKa = 3.58TT195 pKa = 4.2
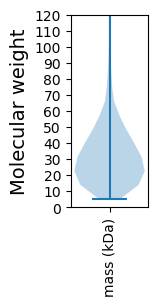
Molecular weight: 21.73 kDa
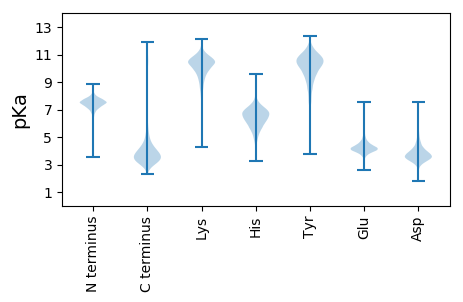
Isoelectric point according different methods:
Protein with the highest isoelectric point:
>tr|M3V004|M3V004_9ACTN P22_AR_N domain-containing protein OS=Gordonia malaquae NBRC 108250 OX=1223542 GN=GM1_041_00280 PE=4 SV=1
MM1 pKa = 7.69AKK3 pKa = 10.06GKK5 pKa = 8.69RR6 pKa = 11.84TFQPNNRR13 pKa = 11.84RR14 pKa = 11.84RR15 pKa = 11.84ARR17 pKa = 11.84VHH19 pKa = 5.99GFRR22 pKa = 11.84LRR24 pKa = 11.84MRR26 pKa = 11.84TRR28 pKa = 11.84AGRR31 pKa = 11.84AIVNGRR37 pKa = 11.84RR38 pKa = 11.84SKK40 pKa = 10.92GRR42 pKa = 11.84AKK44 pKa = 9.67LTAA47 pKa = 4.21
MM1 pKa = 7.69AKK3 pKa = 10.06GKK5 pKa = 8.69RR6 pKa = 11.84TFQPNNRR13 pKa = 11.84RR14 pKa = 11.84RR15 pKa = 11.84ARR17 pKa = 11.84VHH19 pKa = 5.99GFRR22 pKa = 11.84LRR24 pKa = 11.84MRR26 pKa = 11.84TRR28 pKa = 11.84AGRR31 pKa = 11.84AIVNGRR37 pKa = 11.84RR38 pKa = 11.84SKK40 pKa = 10.92GRR42 pKa = 11.84AKK44 pKa = 9.67LTAA47 pKa = 4.21
Molecular weight: 5.46 kDa
Isoelectric point according different methods:
Peptides (in silico digests for buttom-up proteomics)
Below you can find in silico digests of the whole proteome with Trypsin, Chymotrypsin, Trypsin+LysC, LysN, ArgC proteases suitable for different mass spec machines.| Try ESI |
 |
|---|
| ChTry ESI |
 |
|---|
| ArgC ESI |
 |
|---|
| LysN ESI |
 |
|---|
| TryLysC ESI |
 |
|---|
| Try MALDI |
 |
|---|
| ChTry MALDI |
 |
|---|
| ArgC MALDI |
 |
|---|
| LysN MALDI |
 |
|---|
| TryLysC MALDI |
 |
|---|
| Try LTQ |
 |
|---|
| ChTry LTQ |
 |
|---|
| ArgC LTQ |
 |
|---|
| LysN LTQ |
 |
|---|
| TryLysC LTQ |
 |
|---|
| Try MSlow |
 |
|---|
| ChTry MSlow |
 |
|---|
| ArgC MSlow |
 |
|---|
| LysN MSlow |
 |
|---|
| TryLysC MSlow |
 |
|---|
| Try MShigh |
 |
|---|
| ChTry MShigh |
 |
|---|
| ArgC MShigh |
 |
|---|
| LysN MShigh |
 |
|---|
| TryLysC MShigh |
 |
|---|
General Statistics
Number of major isoforms |
Number of additional isoforms |
Number of all proteins |
Number of amino acids |
Min. Seq. Length |
Max. Seq. Length |
Avg. Seq. Length |
Avg. Mol. Weight |
|---|---|---|---|---|---|---|---|
0 |
1358179 |
47 |
8234 |
318.1 |
34.06 |
Amino acid frequency
Ala |
Cys |
Asp |
Glu |
Phe |
Gly |
His |
Ile |
Lys |
Leu |
|---|---|---|---|---|---|---|---|---|---|
12.818 ± 0.046 | 0.705 ± 0.01 |
6.943 ± 0.037 | 5.106 ± 0.035 |
3.0 ± 0.02 | 8.848 ± 0.03 |
2.04 ± 0.017 | 4.399 ± 0.03 |
2.291 ± 0.032 | 9.379 ± 0.036 |
Met |
Asn |
Gln |
Pro |
Arg |
Ser |
Thr |
Val |
Trp |
Tyr |
|---|---|---|---|---|---|---|---|---|---|
2.059 ± 0.017 | 2.126 ± 0.018 |
5.382 ± 0.029 | 2.647 ± 0.022 |
7.208 ± 0.036 | 5.954 ± 0.028 |
6.374 ± 0.027 | 9.264 ± 0.037 |
1.441 ± 0.016 | 2.015 ± 0.017 |
Most of the basic statistics you can see at this page can be downloaded from this CSV file
Proteome-pI is available under Creative Commons Attribution-NoDerivs license, for more details see here
| Reference: Kozlowski LP. Proteome-pI 2.0: Proteome Isoelectric Point Database Update. Nucleic Acids Res. 2021, doi: 10.1093/nar/gkab944 | Contact: Lukasz P. Kozlowski |
