Synechococcus phage ACG-2014g
Taxonomy: Viruses; Duplodnaviria; Heunggongvirae; Uroviricota; Caudoviricetes; Caudovirales; Myoviridae; Acionnavirus; unclassified Acionnavirus
Average proteome isoelectric point is 5.7
Get precalculated fractions of proteins

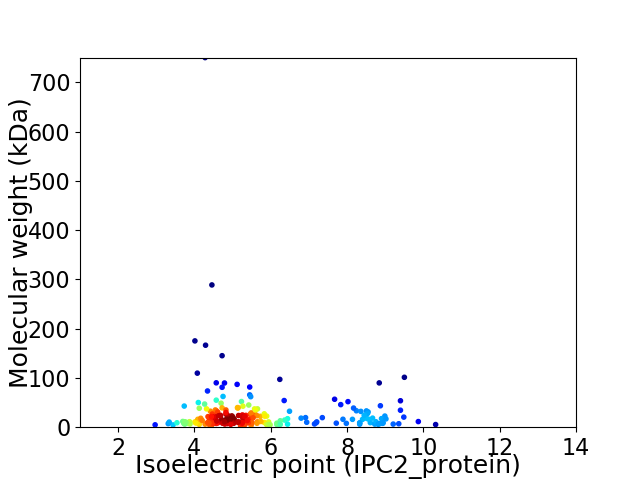
Virtual 2D-PAGE plot for 216 proteins (isoelectric point calculated using IPC2_protein)
Get csv file with sequences according to given criteria:
* You can choose from 21 different methods for calculating isoelectric point
Summary statistics related to proteome-wise predictions


Protein with the lowest isoelectric point:
>tr|A0A0E3FDK0|A0A0E3FDK0_9CAUD Tail tube monomer protein OS=Synechococcus phage ACG-2014g OX=1493512 GN=Syn7803US105_105 PE=4 SV=1
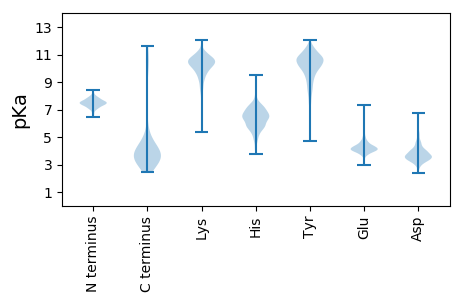
MM1 pKa = 7.48TKK3 pKa = 10.24QSLGLGTTANDD14 pKa = 3.41NTGDD18 pKa = 3.84TLRR21 pKa = 11.84VGGDD25 pKa = 3.53KK26 pKa = 11.01INDD29 pKa = 3.71NFDD32 pKa = 4.03EE33 pKa = 4.82IYY35 pKa = 10.69SAFGNGTNLTLNVSNAATNQVLKK58 pKa = 11.22YY59 pKa = 9.44NGTSFVPGDD68 pKa = 3.84LGLLTTALDD77 pKa = 3.77VNNNNITSSSNNNISLVPNGTGDD100 pKa = 3.65LRR102 pKa = 11.84IVAGSITSTFDD113 pKa = 3.4GDD115 pKa = 4.01DD116 pKa = 3.67GTVDD120 pKa = 4.32FPTKK124 pKa = 9.63IRR126 pKa = 11.84YY127 pKa = 8.58INEE130 pKa = 3.92YY131 pKa = 9.07TSLGVAPASATYY143 pKa = 9.04TGYY146 pKa = 10.88FFTVDD151 pKa = 3.71GDD153 pKa = 3.95DD154 pKa = 3.72NPYY157 pKa = 11.1VNINVTAGGVGDD169 pKa = 4.17TAAKK173 pKa = 10.03IATEE177 pKa = 3.97YY178 pKa = 11.26SSIDD182 pKa = 3.52FLNDD186 pKa = 2.49VDD188 pKa = 4.22TTTVAPANDD197 pKa = 3.68QVLKK201 pKa = 10.25WSASSSKK208 pKa = 9.93WIPQDD213 pKa = 3.6DD214 pKa = 4.14QSGLTALNLFQTVTADD230 pKa = 3.42TGSTTANSGTDD241 pKa = 3.27TLIIAGGTDD250 pKa = 3.11IDD252 pKa = 4.04TAIVGDD258 pKa = 3.97TVTVNFSGVVPSTLDD273 pKa = 3.13TLSNVDD279 pKa = 4.55LSSLVQGDD287 pKa = 3.64SFYY290 pKa = 11.45YY291 pKa = 10.72NGTNWVRR298 pKa = 11.84SQSPLTWFEE307 pKa = 4.05LGSNGFNHH315 pKa = 6.09FTFSGAGFPVTQDD328 pKa = 3.17DD329 pKa = 3.79PTIYY333 pKa = 10.22VYY335 pKa = 10.71RR336 pKa = 11.84GFTYY340 pKa = 10.8AFDD343 pKa = 3.88NSSNGASHH351 pKa = 7.92PLRR354 pKa = 11.84IQSTTGLSGNPYY366 pKa = 9.38TVGQSGNGTSVLYY379 pKa = 7.98WTVPMDD385 pKa = 4.32APTTLYY391 pKa = 9.62YY392 pKa = 10.59QCTVHH397 pKa = 7.08AAMAGTIVVVNN408 pKa = 4.25
MM1 pKa = 7.48TKK3 pKa = 10.24QSLGLGTTANDD14 pKa = 3.41NTGDD18 pKa = 3.84TLRR21 pKa = 11.84VGGDD25 pKa = 3.53KK26 pKa = 11.01INDD29 pKa = 3.71NFDD32 pKa = 4.03EE33 pKa = 4.82IYY35 pKa = 10.69SAFGNGTNLTLNVSNAATNQVLKK58 pKa = 11.22YY59 pKa = 9.44NGTSFVPGDD68 pKa = 3.84LGLLTTALDD77 pKa = 3.77VNNNNITSSSNNNISLVPNGTGDD100 pKa = 3.65LRR102 pKa = 11.84IVAGSITSTFDD113 pKa = 3.4GDD115 pKa = 4.01DD116 pKa = 3.67GTVDD120 pKa = 4.32FPTKK124 pKa = 9.63IRR126 pKa = 11.84YY127 pKa = 8.58INEE130 pKa = 3.92YY131 pKa = 9.07TSLGVAPASATYY143 pKa = 9.04TGYY146 pKa = 10.88FFTVDD151 pKa = 3.71GDD153 pKa = 3.95DD154 pKa = 3.72NPYY157 pKa = 11.1VNINVTAGGVGDD169 pKa = 4.17TAAKK173 pKa = 10.03IATEE177 pKa = 3.97YY178 pKa = 11.26SSIDD182 pKa = 3.52FLNDD186 pKa = 2.49VDD188 pKa = 4.22TTTVAPANDD197 pKa = 3.68QVLKK201 pKa = 10.25WSASSSKK208 pKa = 9.93WIPQDD213 pKa = 3.6DD214 pKa = 4.14QSGLTALNLFQTVTADD230 pKa = 3.42TGSTTANSGTDD241 pKa = 3.27TLIIAGGTDD250 pKa = 3.11IDD252 pKa = 4.04TAIVGDD258 pKa = 3.97TVTVNFSGVVPSTLDD273 pKa = 3.13TLSNVDD279 pKa = 4.55LSSLVQGDD287 pKa = 3.64SFYY290 pKa = 11.45YY291 pKa = 10.72NGTNWVRR298 pKa = 11.84SQSPLTWFEE307 pKa = 4.05LGSNGFNHH315 pKa = 6.09FTFSGAGFPVTQDD328 pKa = 3.17DD329 pKa = 3.79PTIYY333 pKa = 10.22VYY335 pKa = 10.71RR336 pKa = 11.84GFTYY340 pKa = 10.8AFDD343 pKa = 3.88NSSNGASHH351 pKa = 7.92PLRR354 pKa = 11.84IQSTTGLSGNPYY366 pKa = 9.38TVGQSGNGTSVLYY379 pKa = 7.98WTVPMDD385 pKa = 4.32APTTLYY391 pKa = 9.62YY392 pKa = 10.59QCTVHH397 pKa = 7.08AAMAGTIVVVNN408 pKa = 4.25
Molecular weight: 42.92 kDa
Isoelectric point according different methods:
Protein with the highest isoelectric point:
>tr|A0A0E3FDC2|A0A0E3FDC2_9CAUD Uncharacterized protein OS=Synechococcus phage ACG-2014g OX=1493512 GN=Syn7803US105_86 PE=4 SV=1
MM1 pKa = 7.23ATRR4 pKa = 11.84SKK6 pKa = 10.92SLSGQNCIEE15 pKa = 4.17SQPKK19 pKa = 8.32KK20 pKa = 8.78TRR22 pKa = 11.84QGNGAHH28 pKa = 6.05TKK30 pKa = 9.57YY31 pKa = 10.82ASSSRR36 pKa = 11.84NNARR40 pKa = 11.84KK41 pKa = 9.87RR42 pKa = 11.84YY43 pKa = 8.59RR44 pKa = 11.84GQGKK48 pKa = 9.26GG49 pKa = 3.22
MM1 pKa = 7.23ATRR4 pKa = 11.84SKK6 pKa = 10.92SLSGQNCIEE15 pKa = 4.17SQPKK19 pKa = 8.32KK20 pKa = 8.78TRR22 pKa = 11.84QGNGAHH28 pKa = 6.05TKK30 pKa = 9.57YY31 pKa = 10.82ASSSRR36 pKa = 11.84NNARR40 pKa = 11.84KK41 pKa = 9.87RR42 pKa = 11.84YY43 pKa = 8.59RR44 pKa = 11.84GQGKK48 pKa = 9.26GG49 pKa = 3.22
Molecular weight: 5.38 kDa
Isoelectric point according different methods:
Peptides (in silico digests for buttom-up proteomics)
Below you can find in silico digests of the whole proteome with Trypsin, Chymotrypsin, Trypsin+LysC, LysN, ArgC proteases suitable for different mass spec machines.| Try ESI |
 |
|---|
| ChTry ESI |
 |
|---|
| ArgC ESI |
 |
|---|
| LysN ESI |
 |
|---|
| TryLysC ESI |
 |
|---|
| Try MALDI |
 |
|---|
| ChTry MALDI |
 |
|---|
| ArgC MALDI |
 |
|---|
| LysN MALDI |
 |
|---|
| TryLysC MALDI |
 |
|---|
| Try LTQ |
 |
|---|
| ChTry LTQ |
 |
|---|
| ArgC LTQ |
 |
|---|
| LysN LTQ |
 |
|---|
| TryLysC LTQ |
 |
|---|
| Try MSlow |
 |
|---|
| ChTry MSlow |
 |
|---|
| ArgC MSlow |
 |
|---|
| LysN MSlow |
 |
|---|
| TryLysC MSlow |
 |
|---|
| Try MShigh |
 |
|---|
| ChTry MShigh |
 |
|---|
| ArgC MShigh |
 |
|---|
| LysN MShigh |
 |
|---|
| TryLysC MShigh |
 |
|---|
General Statistics
Number of major isoforms |
Number of additional isoforms |
Number of all proteins |
Number of amino acids |
Min. Seq. Length |
Max. Seq. Length |
Avg. Seq. Length |
Avg. Mol. Weight |
|---|---|---|---|---|---|---|---|
0 |
55649 |
31 |
7019 |
257.6 |
28.52 |
Amino acid frequency
Ala |
Cys |
Asp |
Glu |
Phe |
Gly |
His |
Ile |
Lys |
Leu |
|---|---|---|---|---|---|---|---|---|---|
6.897 ± 0.219 | 0.895 ± 0.098 |
6.573 ± 0.142 | 6.178 ± 0.298 |
4.365 ± 0.117 | 7.923 ± 0.336 |
1.483 ± 0.126 | 6.417 ± 0.216 |
5.535 ± 0.416 | 7.211 ± 0.187 |
Met |
Asn |
Gln |
Pro |
Arg |
Ser |
Thr |
Val |
Trp |
Tyr |
|---|---|---|---|---|---|---|---|---|---|
2.014 ± 0.229 | 5.944 ± 0.169 |
3.912 ± 0.117 | 3.569 ± 0.115 |
3.998 ± 0.156 | 7.373 ± 0.26 |
7.619 ± 0.479 | 6.832 ± 0.197 |
1.096 ± 0.087 | 4.165 ± 0.125 |
Most of the basic statistics you can see at this page can be downloaded from this CSV file
Proteome-pI is available under Creative Commons Attribution-NoDerivs license, for more details see here
| Reference: Kozlowski LP. Proteome-pI 2.0: Proteome Isoelectric Point Database Update. Nucleic Acids Res. 2021, doi: 10.1093/nar/gkab944 | Contact: Lukasz P. Kozlowski |
