Macaca mulatta feces associated virus 3
Taxonomy: Viruses; Monodnaviria; Shotokuvirae; Cressdnaviricota; Arfiviricetes; Cremevirales; Smacoviridae; Porprismacovirus; Porprismacovirus macas3
Average proteome isoelectric point is 7.78
Get precalculated fractions of proteins

Virtual 2D-PAGE plot for 3 proteins (isoelectric point calculated using IPC2_protein)
Get csv file with sequences according to given criteria:
* You can choose from 21 different methods for calculating isoelectric point
Summary statistics related to proteome-wise predictions


Protein with the lowest isoelectric point:
>tr|A0A1W5PZP4|A0A1W5PZP4_9VIRU Cap OS=Macaca mulatta feces associated virus 3 OX=2499225 PE=4 SV=1
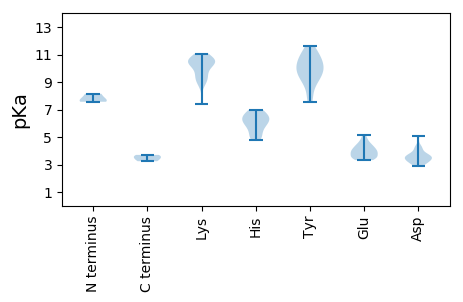
MM1 pKa = 8.15IMFVKK6 pKa = 10.62VSEE9 pKa = 4.46TYY11 pKa = 10.75DD12 pKa = 3.33LSTKK16 pKa = 8.75VGKK19 pKa = 9.33MGLVGIHH26 pKa = 5.42TPEE29 pKa = 3.73GRR31 pKa = 11.84LVYY34 pKa = 10.03KK35 pKa = 10.33HH36 pKa = 6.18WEE38 pKa = 4.08GLYY41 pKa = 10.0KK42 pKa = 10.45NYY44 pKa = 10.15RR45 pKa = 11.84RR46 pKa = 11.84VRR48 pKa = 11.84FASCDD53 pKa = 3.32VAMACASMLPADD65 pKa = 4.26PLQIGVEE72 pKa = 4.06AGSIAPQDD80 pKa = 3.62MFNPILYY87 pKa = 8.86KK88 pKa = 10.64ACSNDD93 pKa = 3.3SMSQILNRR101 pKa = 11.84IYY103 pKa = 10.9AGSTATNVDD112 pKa = 3.35VAKK115 pKa = 10.97NSIIASNEE123 pKa = 3.48ASFGNAGVVVGEE135 pKa = 4.74HH136 pKa = 5.86GAEE139 pKa = 4.15SVSNTPSQFDD149 pKa = 2.98IYY151 pKa = 11.06YY152 pKa = 11.08ALLSDD157 pKa = 3.58TNGWKK162 pKa = 10.23KK163 pKa = 10.97AMPQAGLQMRR173 pKa = 11.84GLYY176 pKa = 9.32PLVWSVVKK184 pKa = 9.75TLGQPSNWSSSIQPEE199 pKa = 3.93IVVPGTNEE207 pKa = 3.53QTGATNYY214 pKa = 10.61GEE216 pKa = 5.11SNTSLGAMGQYY227 pKa = 9.33MRR229 pKa = 11.84GPAMRR234 pKa = 11.84MPACDD239 pKa = 3.21TYY241 pKa = 11.66VATNMDD247 pKa = 3.68GGQTVNVDD255 pKa = 3.05NVDD258 pKa = 3.64LVKK261 pKa = 10.65IRR263 pKa = 11.84DD264 pKa = 3.59NDD266 pKa = 3.57KK267 pKa = 11.07AYY269 pKa = 7.53PTQNSIDD276 pKa = 3.74KK277 pKa = 9.18FFPSPIANFAKK288 pKa = 10.5PNLDD292 pKa = 4.29LPDD295 pKa = 4.1CFVGVMILPPATLNQLYY312 pKa = 10.19YY313 pKa = 10.14RR314 pKa = 11.84LKK316 pKa = 9.08VTWTVEE322 pKa = 3.97FSEE325 pKa = 4.29PRR327 pKa = 11.84SLTEE331 pKa = 3.44LTNWYY336 pKa = 9.52GLQSTGIQSYY346 pKa = 8.11ATDD349 pKa = 3.61YY350 pKa = 9.2ATQTQALKK358 pKa = 10.89NSGSSVTLGMLDD370 pKa = 3.4TSEE373 pKa = 3.91VDD375 pKa = 2.88AVKK378 pKa = 10.53IMEE381 pKa = 4.44GNN383 pKa = 3.24
MM1 pKa = 8.15IMFVKK6 pKa = 10.62VSEE9 pKa = 4.46TYY11 pKa = 10.75DD12 pKa = 3.33LSTKK16 pKa = 8.75VGKK19 pKa = 9.33MGLVGIHH26 pKa = 5.42TPEE29 pKa = 3.73GRR31 pKa = 11.84LVYY34 pKa = 10.03KK35 pKa = 10.33HH36 pKa = 6.18WEE38 pKa = 4.08GLYY41 pKa = 10.0KK42 pKa = 10.45NYY44 pKa = 10.15RR45 pKa = 11.84RR46 pKa = 11.84VRR48 pKa = 11.84FASCDD53 pKa = 3.32VAMACASMLPADD65 pKa = 4.26PLQIGVEE72 pKa = 4.06AGSIAPQDD80 pKa = 3.62MFNPILYY87 pKa = 8.86KK88 pKa = 10.64ACSNDD93 pKa = 3.3SMSQILNRR101 pKa = 11.84IYY103 pKa = 10.9AGSTATNVDD112 pKa = 3.35VAKK115 pKa = 10.97NSIIASNEE123 pKa = 3.48ASFGNAGVVVGEE135 pKa = 4.74HH136 pKa = 5.86GAEE139 pKa = 4.15SVSNTPSQFDD149 pKa = 2.98IYY151 pKa = 11.06YY152 pKa = 11.08ALLSDD157 pKa = 3.58TNGWKK162 pKa = 10.23KK163 pKa = 10.97AMPQAGLQMRR173 pKa = 11.84GLYY176 pKa = 9.32PLVWSVVKK184 pKa = 9.75TLGQPSNWSSSIQPEE199 pKa = 3.93IVVPGTNEE207 pKa = 3.53QTGATNYY214 pKa = 10.61GEE216 pKa = 5.11SNTSLGAMGQYY227 pKa = 9.33MRR229 pKa = 11.84GPAMRR234 pKa = 11.84MPACDD239 pKa = 3.21TYY241 pKa = 11.66VATNMDD247 pKa = 3.68GGQTVNVDD255 pKa = 3.05NVDD258 pKa = 3.64LVKK261 pKa = 10.65IRR263 pKa = 11.84DD264 pKa = 3.59NDD266 pKa = 3.57KK267 pKa = 11.07AYY269 pKa = 7.53PTQNSIDD276 pKa = 3.74KK277 pKa = 9.18FFPSPIANFAKK288 pKa = 10.5PNLDD292 pKa = 4.29LPDD295 pKa = 4.1CFVGVMILPPATLNQLYY312 pKa = 10.19YY313 pKa = 10.14RR314 pKa = 11.84LKK316 pKa = 9.08VTWTVEE322 pKa = 3.97FSEE325 pKa = 4.29PRR327 pKa = 11.84SLTEE331 pKa = 3.44LTNWYY336 pKa = 9.52GLQSTGIQSYY346 pKa = 8.11ATDD349 pKa = 3.61YY350 pKa = 9.2ATQTQALKK358 pKa = 10.89NSGSSVTLGMLDD370 pKa = 3.4TSEE373 pKa = 3.91VDD375 pKa = 2.88AVKK378 pKa = 10.53IMEE381 pKa = 4.44GNN383 pKa = 3.24
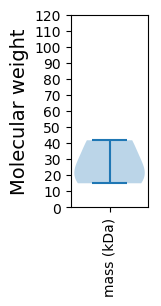
Molecular weight: 41.7 kDa
Isoelectric point according different methods:
Protein with the highest isoelectric point:
>tr|A0A1W5PZP4|A0A1W5PZP4_9VIRU Cap OS=Macaca mulatta feces associated virus 3 OX=2499225 PE=4 SV=1
MM1 pKa = 7.68TSPQKK6 pKa = 10.37LEE8 pKa = 3.32KK9 pKa = 9.47WAWLVSILQKK19 pKa = 10.77EE20 pKa = 4.83GWFTNTGKK28 pKa = 10.43DD29 pKa = 3.15STKK32 pKa = 10.02IIVVFVSLLAMLLWLVPRR50 pKa = 11.84CCLPILSRR58 pKa = 11.84SVLKK62 pKa = 10.43LVRR65 pKa = 11.84SRR67 pKa = 11.84PRR69 pKa = 11.84TCLIRR74 pKa = 11.84SCTKK78 pKa = 9.74PVPTTRR84 pKa = 11.84CLRR87 pKa = 11.84SSTEE91 pKa = 3.84SMLDD95 pKa = 3.41LPQQMWMSPRR105 pKa = 11.84TRR107 pKa = 11.84SLLLMKK113 pKa = 10.57LLLGTLVWLSVNTVLSLL130 pKa = 3.7
MM1 pKa = 7.68TSPQKK6 pKa = 10.37LEE8 pKa = 3.32KK9 pKa = 9.47WAWLVSILQKK19 pKa = 10.77EE20 pKa = 4.83GWFTNTGKK28 pKa = 10.43DD29 pKa = 3.15STKK32 pKa = 10.02IIVVFVSLLAMLLWLVPRR50 pKa = 11.84CCLPILSRR58 pKa = 11.84SVLKK62 pKa = 10.43LVRR65 pKa = 11.84SRR67 pKa = 11.84PRR69 pKa = 11.84TCLIRR74 pKa = 11.84SCTKK78 pKa = 9.74PVPTTRR84 pKa = 11.84CLRR87 pKa = 11.84SSTEE91 pKa = 3.84SMLDD95 pKa = 3.41LPQQMWMSPRR105 pKa = 11.84TRR107 pKa = 11.84SLLLMKK113 pKa = 10.57LLLGTLVWLSVNTVLSLL130 pKa = 3.7
Molecular weight: 14.89 kDa
Isoelectric point according different methods:
Peptides (in silico digests for buttom-up proteomics)
Below you can find in silico digests of the whole proteome with Trypsin, Chymotrypsin, Trypsin+LysC, LysN, ArgC proteases suitable for different mass spec machines.| Try ESI |
 |
|---|
| ChTry ESI |
 |
|---|
| ArgC ESI |
 |
|---|
| LysN ESI |
 |
|---|
| TryLysC ESI |
 |
|---|
| Try MALDI |
 |
|---|
| ChTry MALDI |
 |
|---|
| ArgC MALDI |
 |
|---|
| LysN MALDI |
 |
|---|
| TryLysC MALDI |
 |
|---|
| Try LTQ |
 |
|---|
| ChTry LTQ |
 |
|---|
| ArgC LTQ |
 |
|---|
| LysN LTQ |
 |
|---|
| TryLysC LTQ |
 |
|---|
| Try MSlow |
 |
|---|
| ChTry MSlow |
 |
|---|
| ArgC MSlow |
 |
|---|
| LysN MSlow |
 |
|---|
| TryLysC MSlow |
 |
|---|
| Try MShigh |
 |
|---|
| ChTry MShigh |
 |
|---|
| ArgC MShigh |
 |
|---|
| LysN MShigh |
 |
|---|
| TryLysC MShigh |
 |
|---|
General Statistics
Number of major isoforms |
Number of additional isoforms |
Number of all proteins |
Number of amino acids |
Min. Seq. Length |
Max. Seq. Length |
Avg. Seq. Length |
Avg. Mol. Weight |
|---|---|---|---|---|---|---|---|
0 |
712 |
130 |
383 |
237.3 |
26.57 |
Amino acid frequency
Ala |
Cys |
Asp |
Glu |
Phe |
Gly |
His |
Ile |
Lys |
Leu |
|---|---|---|---|---|---|---|---|---|---|
5.618 ± 1.772 | 1.826 ± 0.592 |
4.213 ± 0.859 | 4.213 ± 0.787 |
1.966 ± 0.467 | 7.444 ± 1.588 |
2.388 ± 1.835 | 4.635 ± 0.242 |
4.916 ± 0.401 | 9.27 ± 3.122 |
Met |
Asn |
Gln |
Pro |
Arg |
Ser |
Thr |
Val |
Trp |
Tyr |
|---|---|---|---|---|---|---|---|---|---|
3.652 ± 0.846 | 4.354 ± 1.523 |
5.056 ± 0.618 | 5.197 ± 1.148 |
8.146 ± 4.345 | 8.006 ± 1.494 |
6.742 ± 0.983 | 8.006 ± 0.199 |
1.685 ± 0.938 | 2.669 ± 1.424 |
Most of the basic statistics you can see at this page can be downloaded from this CSV file
Proteome-pI is available under Creative Commons Attribution-NoDerivs license, for more details see here
| Reference: Kozlowski LP. Proteome-pI 2.0: Proteome Isoelectric Point Database Update. Nucleic Acids Res. 2021, doi: 10.1093/nar/gkab944 | Contact: Lukasz P. Kozlowski |
