Bacillus phage BCP8-2
Taxonomy: Viruses; Duplodnaviria; Heunggongvirae; Uroviricota; Caudoviricetes; Caudovirales; Herelleviridae; Bastillevirinae; Caeruleovirus; Bacillus virus BCP82
Average proteome isoelectric point is 6.05
Get precalculated fractions of proteins

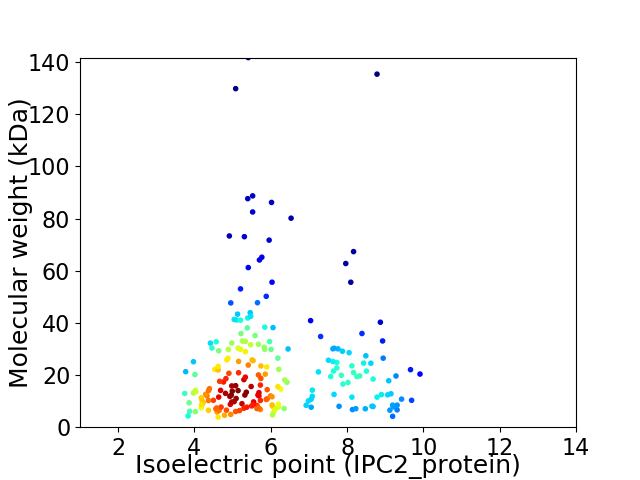
Virtual 2D-PAGE plot for 220 proteins (isoelectric point calculated using IPC2_protein)
Get csv file with sequences according to given criteria:
* You can choose from 21 different methods for calculating isoelectric point
Summary statistics related to proteome-wise predictions


Protein with the lowest isoelectric point:
>tr|A0A0E3D9N9|A0A0E3D9N9_9CAUD Putative major capsid OS=Bacillus phage BCP8-2 OX=1129192 GN=BCP8-2_020 PE=4 SV=1
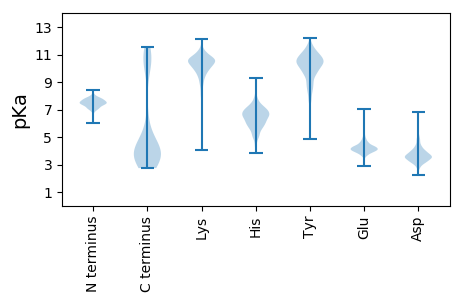
MM1 pKa = 7.67KK2 pKa = 10.24IPWEE6 pKa = 4.44CEE8 pKa = 3.77DD9 pKa = 4.59CGHH12 pKa = 6.98KK13 pKa = 10.38EE14 pKa = 3.65LASPFDD20 pKa = 3.77TFMLCPNCDD29 pKa = 3.22SQNFFHH35 pKa = 7.24GSIIEE40 pKa = 4.57DD41 pKa = 3.67DD42 pKa = 3.85LEE44 pKa = 4.33EE45 pKa = 4.42YY46 pKa = 10.58NVYY49 pKa = 10.71DD50 pKa = 5.6EE51 pKa = 5.56EE52 pKa = 6.53DD53 pKa = 3.44EE54 pKa = 4.41LDD56 pKa = 3.62NVVVFEE62 pKa = 4.29DD63 pKa = 3.69QYY65 pKa = 11.74GEE67 pKa = 4.16KK68 pKa = 9.61LTIVQEE74 pKa = 4.01IDD76 pKa = 3.25DD77 pKa = 5.19DD78 pKa = 5.18GDD80 pKa = 3.96INLLPSDD87 pKa = 3.99RR88 pKa = 11.84NLFFSKK94 pKa = 10.41EE95 pKa = 3.88DD96 pKa = 4.04AIEE99 pKa = 3.86LAKK102 pKa = 10.81AILRR106 pKa = 11.84VCGEE110 pKa = 4.15EE111 pKa = 4.02EE112 pKa = 3.81
MM1 pKa = 7.67KK2 pKa = 10.24IPWEE6 pKa = 4.44CEE8 pKa = 3.77DD9 pKa = 4.59CGHH12 pKa = 6.98KK13 pKa = 10.38EE14 pKa = 3.65LASPFDD20 pKa = 3.77TFMLCPNCDD29 pKa = 3.22SQNFFHH35 pKa = 7.24GSIIEE40 pKa = 4.57DD41 pKa = 3.67DD42 pKa = 3.85LEE44 pKa = 4.33EE45 pKa = 4.42YY46 pKa = 10.58NVYY49 pKa = 10.71DD50 pKa = 5.6EE51 pKa = 5.56EE52 pKa = 6.53DD53 pKa = 3.44EE54 pKa = 4.41LDD56 pKa = 3.62NVVVFEE62 pKa = 4.29DD63 pKa = 3.69QYY65 pKa = 11.74GEE67 pKa = 4.16KK68 pKa = 9.61LTIVQEE74 pKa = 4.01IDD76 pKa = 3.25DD77 pKa = 5.19DD78 pKa = 5.18GDD80 pKa = 3.96INLLPSDD87 pKa = 3.99RR88 pKa = 11.84NLFFSKK94 pKa = 10.41EE95 pKa = 3.88DD96 pKa = 4.04AIEE99 pKa = 3.86LAKK102 pKa = 10.81AILRR106 pKa = 11.84VCGEE110 pKa = 4.15EE111 pKa = 4.02EE112 pKa = 3.81
Molecular weight: 12.95 kDa
Isoelectric point according different methods:
Protein with the highest isoelectric point:
>tr|A0A0E3D9S3|A0A0E3D9S3_9CAUD Putative baseplate protein II OS=Bacillus phage BCP8-2 OX=1129192 GN=BCP8-2_214 PE=4 SV=1
MM1 pKa = 7.59LVQHH5 pKa = 6.04YY6 pKa = 10.37KK7 pKa = 10.89GIRR10 pKa = 11.84LQLINRR16 pKa = 11.84RR17 pKa = 11.84YY18 pKa = 10.33GNRR21 pKa = 11.84KK22 pKa = 9.04AKK24 pKa = 10.31RR25 pKa = 11.84FTLGGTNQNVWIPNKK40 pKa = 10.13HH41 pKa = 6.03LEE43 pKa = 4.11EE44 pKa = 5.72DD45 pKa = 3.95GSIKK49 pKa = 10.38QGEE52 pKa = 4.29NIDD55 pKa = 3.73YY56 pKa = 10.22VFRR59 pKa = 11.84RR60 pKa = 11.84AQRR63 pKa = 11.84QLEE66 pKa = 4.15LAGYY70 pKa = 6.61TEE72 pKa = 5.12PIIGIKK78 pKa = 9.96RR79 pKa = 11.84RR80 pKa = 11.84TIVEE84 pKa = 3.75EE85 pKa = 4.48RR86 pKa = 11.84II87 pKa = 3.59
MM1 pKa = 7.59LVQHH5 pKa = 6.04YY6 pKa = 10.37KK7 pKa = 10.89GIRR10 pKa = 11.84LQLINRR16 pKa = 11.84RR17 pKa = 11.84YY18 pKa = 10.33GNRR21 pKa = 11.84KK22 pKa = 9.04AKK24 pKa = 10.31RR25 pKa = 11.84FTLGGTNQNVWIPNKK40 pKa = 10.13HH41 pKa = 6.03LEE43 pKa = 4.11EE44 pKa = 5.72DD45 pKa = 3.95GSIKK49 pKa = 10.38QGEE52 pKa = 4.29NIDD55 pKa = 3.73YY56 pKa = 10.22VFRR59 pKa = 11.84RR60 pKa = 11.84AQRR63 pKa = 11.84QLEE66 pKa = 4.15LAGYY70 pKa = 6.61TEE72 pKa = 5.12PIIGIKK78 pKa = 9.96RR79 pKa = 11.84RR80 pKa = 11.84TIVEE84 pKa = 3.75EE85 pKa = 4.48RR86 pKa = 11.84II87 pKa = 3.59
Molecular weight: 10.31 kDa
Isoelectric point according different methods:
Peptides (in silico digests for buttom-up proteomics)
Below you can find in silico digests of the whole proteome with Trypsin, Chymotrypsin, Trypsin+LysC, LysN, ArgC proteases suitable for different mass spec machines.| Try ESI |
 |
|---|
| ChTry ESI |
 |
|---|
| ArgC ESI |
 |
|---|
| LysN ESI |
 |
|---|
| TryLysC ESI |
 |
|---|
| Try MALDI |
 |
|---|
| ChTry MALDI |
 |
|---|
| ArgC MALDI |
 |
|---|
| LysN MALDI |
 |
|---|
| TryLysC MALDI |
 |
|---|
| Try LTQ |
 |
|---|
| ChTry LTQ |
 |
|---|
| ArgC LTQ |
 |
|---|
| LysN LTQ |
 |
|---|
| TryLysC LTQ |
 |
|---|
| Try MSlow |
 |
|---|
| ChTry MSlow |
 |
|---|
| ArgC MSlow |
 |
|---|
| LysN MSlow |
 |
|---|
| TryLysC MSlow |
 |
|---|
| Try MShigh |
 |
|---|
| ChTry MShigh |
 |
|---|
| ArgC MShigh |
 |
|---|
| LysN MShigh |
 |
|---|
| TryLysC MShigh |
 |
|---|
General Statistics
Number of major isoforms |
Number of additional isoforms |
Number of all proteins |
Number of amino acids |
Min. Seq. Length |
Max. Seq. Length |
Avg. Seq. Length |
Avg. Mol. Weight |
|---|---|---|---|---|---|---|---|
0 |
45866 |
34 |
1288 |
208.5 |
23.72 |
Amino acid frequency
Ala |
Cys |
Asp |
Glu |
Phe |
Gly |
His |
Ile |
Lys |
Leu |
|---|---|---|---|---|---|---|---|---|---|
5.819 ± 0.203 | 0.798 ± 0.067 |
6.255 ± 0.12 | 8.01 ± 0.291 |
3.807 ± 0.11 | 6.608 ± 0.242 |
1.84 ± 0.099 | 6.543 ± 0.134 |
7.999 ± 0.191 | 8.01 ± 0.206 |
Met |
Asn |
Gln |
Pro |
Arg |
Ser |
Thr |
Val |
Trp |
Tyr |
|---|---|---|---|---|---|---|---|---|---|
2.684 ± 0.093 | 5.335 ± 0.168 |
3.297 ± 0.14 | 3.726 ± 0.129 |
4.489 ± 0.132 | 5.73 ± 0.16 |
6.299 ± 0.217 | 7.003 ± 0.16 |
1.212 ± 0.074 | 4.535 ± 0.134 |
Most of the basic statistics you can see at this page can be downloaded from this CSV file
Proteome-pI is available under Creative Commons Attribution-NoDerivs license, for more details see here
| Reference: Kozlowski LP. Proteome-pI 2.0: Proteome Isoelectric Point Database Update. Nucleic Acids Res. 2021, doi: 10.1093/nar/gkab944 | Contact: Lukasz P. Kozlowski |
